Fractional Cover
Date modified: November 2024
Due to unavailability of suitable field data from Africa, the FC service hasn’t been quantitatively evaluated in Africa and therefore is provided as a provisional service. We welcome feedback from users.
Service overview
Background
The Fractional Cover (FC) service provides estimates of the proportions of green vegetation, non-green vegetation (including deciduous trees during autumn, dry grass, etc.), and bare soils for every Landsat pixel. Fractional cover provides valuable information for a range of environmental and agricultural applications, including:
soil erosion monitoring
land surface process modelling
land management practices (e.g. crop rotation, stubble management, rangeland management)
vegetation studies
fuel load estimation
ecosystem modelling
land cover mapping
The algorithm is developed by the Joint Remote Sensing Research Program (JRSRP) and is described in Scarth et al. (2010). Field data collected across Australia have been used to calibrate and validate the unmixing model.
The DE Africa FC service has two components:
Fractional Cover, which is estimated from each Landsat scene, providing measurements from individual days.
Fractional Cover Annual Summary (Percentiles), which provides 10th, 50th, and 90th percentiles estimated independently for the green vegetation, non-green vegetation, and bare soil fractions observed in each calendar year (1st of January - 31st December).
While the scene based Fractional Cover can be used to study dynamic processes, the annual summaries make it easier to analyse year to year changes. The percentiles provide robust estimates of the low, median and high proportion values observed for each cover type in a year, which can be used to characterise the land cover. Before the percentile calculation, areas of water and cloud cover, as mapped in the Water Observations from Space (WOfS) Feature Layer, are exluded.
A Jupyter Notebook which demonstrates loading and using the Fractional Cover dataset in the Sandbox is also available.
Specifications
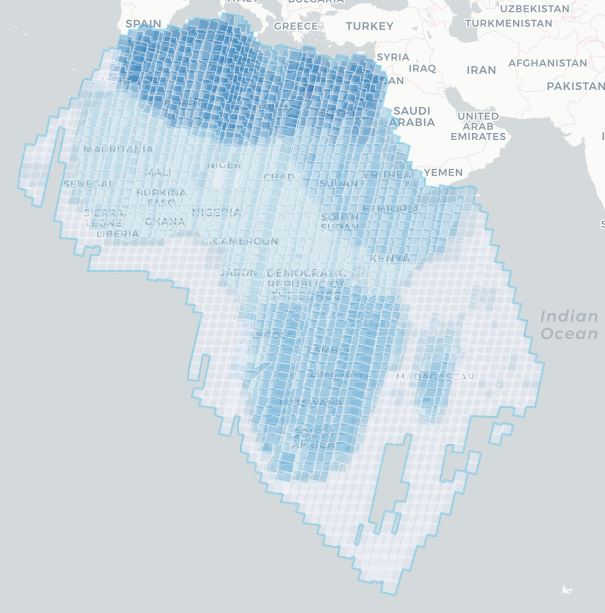
Coverage and metadata can be viewed on DE Africa Metadata Explorer for:
Table 1: Fractional Cover specifications
Specification |
||
|---|---|---|
Product name |
Fractonal Cover |
Fractonal Cover Annual Summary |
Cell size - X (metres) |
30 |
30 |
Cell size - Y (metres) |
30 |
30 |
Coordinate reference system |
Universal Transverse Mercator (UTM) |
EPSG: 6933 |
Temporal resolution |
16 days |
Annual |
Temporal range |
1984 – present |
1984-2023 |
Parent dataset |
Landsat Collection 2 Surface Reflectance |
Fractional Cover scenes |
Update frequency |
Daily |
Annual |
Update latency |
NA |
2 months from end of previous year |
Table 2: Fractional Cover measurements
Band ID |
Description |
Value range |
Data type |
No data value |
|---|---|---|---|---|
bs |
Bare soil percentage |
|
|
|
pv |
Photosynthetic (green) vegetation percentage |
|
|
|
npv |
Non-photosynthetic (non-green) vegetation percentage |
|
|
|
ue |
Unmixing error |
|
|
|
Due to model uncertainties, some areas may show cover values in excess of 100%. These areas can either be excluded or treated as equivalent to 100%.
For the unmixing error (ue) band, the values are scaled between 0 and 127. High unmixing error values represent areas of high model uncertainty (areas of water, cloud, cloud shadow or soil types/colours that were not included in the model training data).
Table 3: Fractional Cover Annual Summary measurements
Band ID |
Description |
Value range |
Data type |
No data value |
|---|---|---|---|---|
bs_pc_10 |
10th percentile Bare soil percentage |
|
|
|
bs_pc_50 |
50th percentile Bare soil percentage |
|
|
|
bs_pc_90 |
90th percentile Bare soil percentage |
|
|
|
pv_pc_10 |
10th percentile Photosynthetic (green) vegetation percentage |
|
|
|
pv_pc_50 |
50th percentile Photosynthetic (green) vegetation percentage |
|
|
|
pv_pc_90 |
90th percentile Photosynthetic (green) vegetation percentage |
|
|
|
npv_pc_10 |
10th percentile Non-photosynthetic (non-green) vegetation percentage |
|
|
|
npv_pc_50 |
50th percentile Non-photosynthetic (non-green) vegetation percentage |
|
|
|
npv_pc_90 |
90th percentile Non-photosynthetic (non-green) vegetation percentage |
|
|
|
count_valid |
Count of clear and valid observations |
|
|
|
qa† |
Quality Assurance band |
|
|
|
\(^\dagger\) The qa band contains addtional quality assurance information for downstream product generation, which is not currently used in DE Africa.
Figure 1: Fractional Cover geographic extent
Processing
The FC algorithm is developed by the Joint Remote Sensing Research Program (JRSRP) and is described in Scarth et al. (2010). Field data collected across Australia have been used to calibrate and validate the unmixing model.
Media and example images
Image 1: Fractional Cover time series
Fractional cover time series for an area along Olifants river, South Africa. Images are selected every 3 months from year 2020 to show seasonal changes. Bare soil, green vegetation and non-green vegeation percentages are shown as Red, Green and Blue. Area identified as water are masked out.
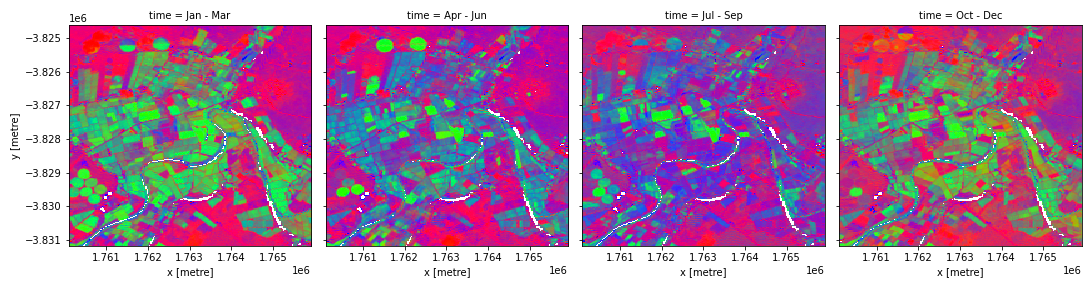
The chart below indicates how the RGB colour composition can be interpreted.
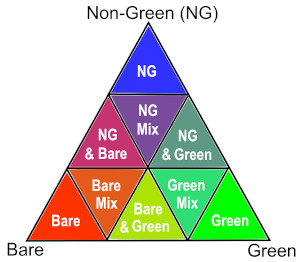
Image 2: Fractional Cover annual percentiles for green cover.
The 10th, 50th, and 90th percentiles, as proxies for low, median and high values, of green cover fraction for 2020, along Olifants river, South Africa.
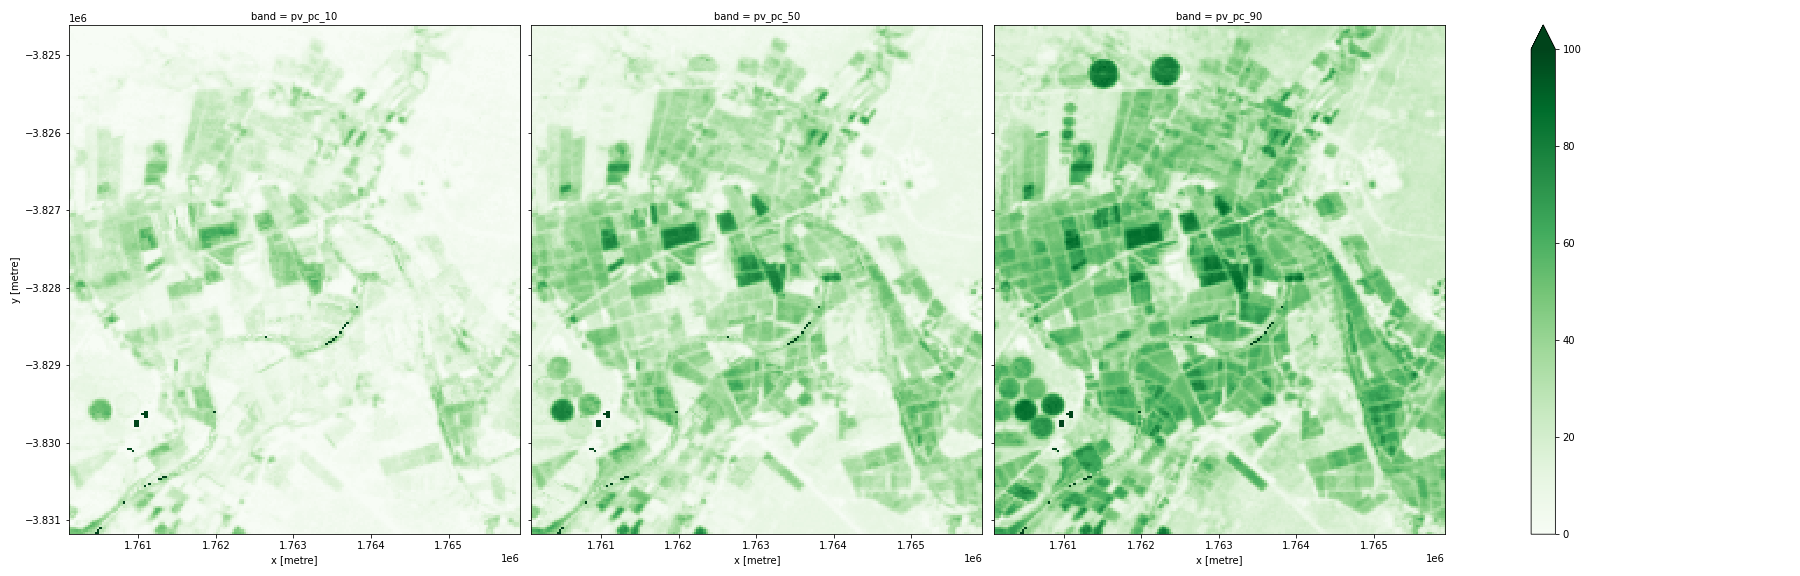
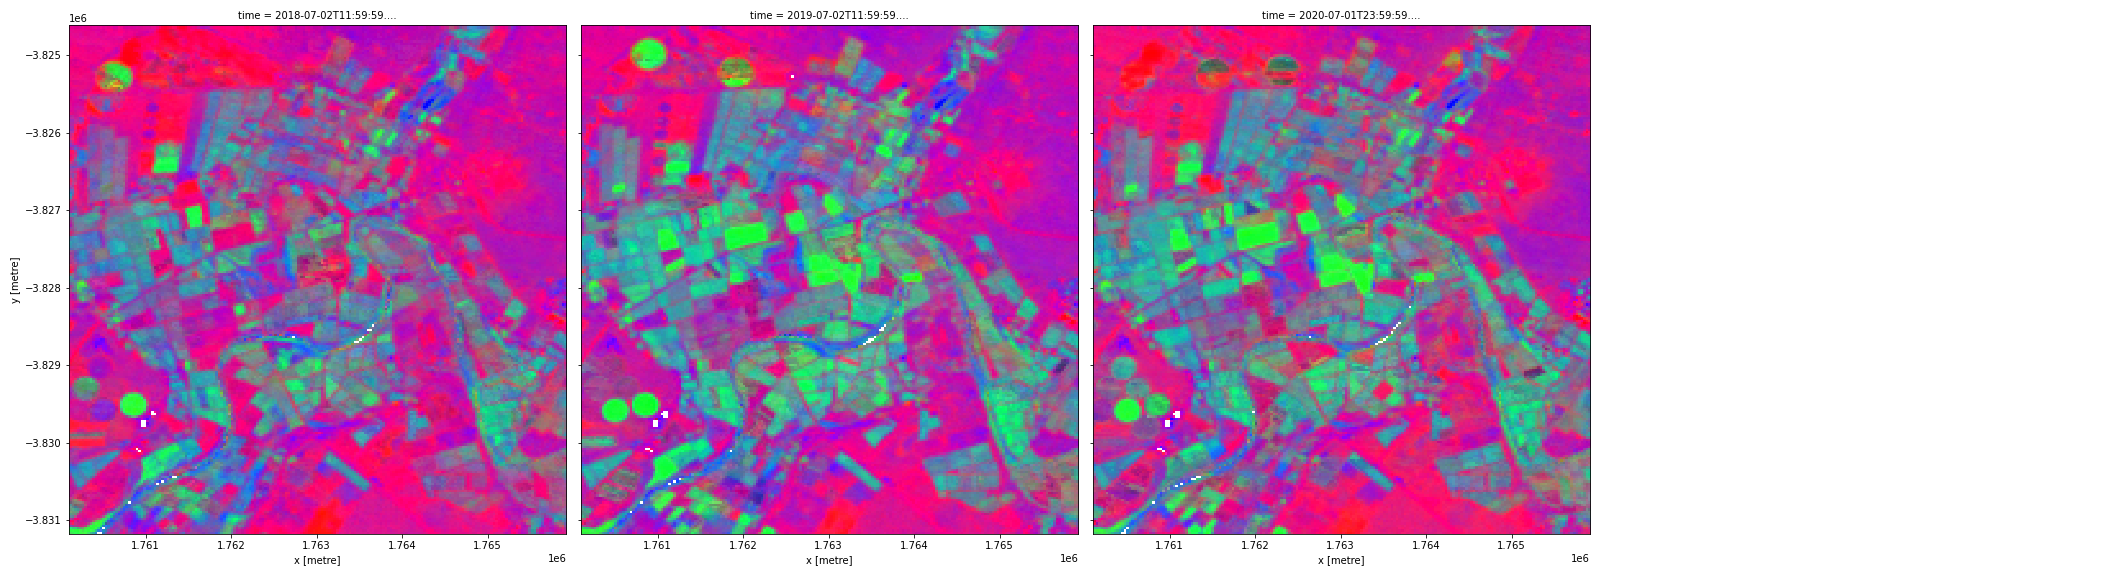
Image 3: Fractional Cover annual summary
The 50th percentile fractional covers from 2018 to 2020, along Olifants river, South Africa.
Related services
References
Flood, N. (2014). Continuity of reflectance data between Landsat-7 ETM+ and Landsat-8 OLI, for both top-of-atmosphere and surface reflectance: A study in the Australian landscape. Remote Sensing, 6(9), 7952-7970. https://doi.org/10.3390/rs6097952
Muir, J., Schmidt, M., Tindall, D., Trevithick, R., Scarth, P. and Stewart, J.B. (2011). Guidelines for field measurement of fractional ground cover: a technical handbook supporting the Australian Collaborative Land Use and Management Program. Queensland Department of Environment and Resource Management for the Australian Bureau of Agricultural and Resource Economics and Sciences.
Scarth, P., Roder, A. and Schmidt, M. (2010). Tracking grazing pressure and climate interaction - the role of Landsat fractional cover in time series analysis. Proceedings of the 15th Australasian Remote Sensing & Photogrammetry Conference.
Schmidt, M., Denham, R. and Scarth, P. (2010), Fractional ground cover monitoring of pastures and agricultural areas in Queensland. Proceedings of the 15th Australasian Remote Sensing & Photogrammetry Conference.
License
CC BY Attribution 4.0 International License
Acknowledgments
The FC algorithms incorporated in this product are the work of Peter Scarth, Joint Remote Sensing Research Program.
Data Access
Amazon Web Services S3
The Digital Earth Africa Fractional Cover data can be accessed from the associated S3 bucket.
Table 4: AWS data access details
AWS S3 details |
|
|---|---|
Bucket ARN |
|
Product names |
|
The bucket is located in the region af-south-1 (Cape Town)
The following file path convention applies to Fractional Cover scenes:
fc_ls/<version>/<path>/<row>/<year>/<month>/<day>/
Annual Summaries omit path, row, month and day:
fc_ls_summary_annual/<version>/<year>/
Table 5: AWS file path convention
File path element |
Description |
Example |
|---|---|---|
|
|
|
|
Product version |
|
|
Landsat path number ranging from |
|
|
Landsat row number ranging from |
|
|
Year the data was collected |
|
|
Month of the year the data was collected (with leading zeros) |
|
|
Day of the month the data was collected (with leading zeros) |
|
OGC Web Services (OWS)
This product is available through DE Africa’s OWS.
Table 6: OWS data access details.
OWS details |
|
|---|---|
Name |
|
Web Map Services (WMS) URL |
|
Web Coverage Service (WCS) URL |
|
Layer names |
|
Digital Earth Africa OWS details can be found at https://ows.digitalearth.africa/.
For instructions on how to connect to OWS, see this tutorial.
Open Data Cube (ODC)
The FC datasets can be accessed through the Digital Earth Africa ODC API, which is available through the Digital Earth Africa Sandbox.
ODC product name: fc_ls, fc_ls_summary_annual
Table 7: Fractional Cover scene ODC band names
Band name |
Alternative names |
|---|---|
bs |
bare |
pv |
green_veg |
npv |
dead_veg |
ue |
err |
Table 8: Fractional Cover Annual Summary ODC band names
Band name |
Alternative names |
|---|---|
For examples on how to use the ODC API, see the DE Africa example notebook repository.
Technical information
Accuracy estimate
The bare soil, green vegetation and non-green vegetation endmembers are calculated using models linked to an intensive field sampling program that covers a wide range of Australian landscapes covering a wide variety of vegetation, soil and climate types were sampled to measure overstorey and ground cover following the procedure outlined in Muir et al (2011).
To provide an estimate of accuracy, the FC algorithm results were compared with 1565 field sites collected in Australia that were not used to train the FC model. Based on the comparison with this independent field data, the FC product has an overall Root Mean Squared Error (RMSE) of 12%. The error margins vary for the three different layers: green RMSE: 12%, non-green RMSE: 17% and bare RMSE: 15%.
Due to unavailability of comparable field data from Africa, we have not been able to quantitatively evaluate the accuracy of the FC measurements for Africa. We therefore provide the service as provisional and welcome feedback from users.
Limitations
The effect of soil moisture may impact the accuracy of the FC product, and the similarity between some bare soil endmembers and non-photosynthetic vegetation endmembers can lead to model instability. Soil types/colours that were not included in the model training data may also be error prone. Pixels that show poor model stability are flagged in the model error band, and can be omitted from further analysis if necessary.
FC products have no water masking applied, so erroneous values for green vegetation over the water may appear. These should be ignored and can be masked out by applying the Water Observations from Space Feature layer. An example of masking cloud and water is available here.
Occasionally the sum of the three components is not equal to 100%. Differences are usually small and are not rounded in order to preserve what may be useful seasonal indicators.
Landsat 8 OLI has different relative spectral response curves to the Landsat 5 TM and Landsat 7 ETM+ sensors. To account for this a spectral band adjustment factor is applied to the Landsat 8 data to make it more similar to reflectance as measured by Landsat 7. The adjustment factors are described in more detail in Flood (2014).
Whilst the same training data has been used to train both the JRSRP fractional cover product and the DE Africa fractional cover product, differences in the surface reflectance data that are used as model inputs mean that the two products are not identical.
Interpreting the FC annual summary
The FC annual summary estimates 10th, 50th, and 90th percentiles independently for the green vegetation, non-green vegetation, and bare soil fractions observed in each calendar year.
Percentiles provide an indicator of where an observation sits, relative to the rest of the observations for the pixel. For example, the 90th percentile is the value below which 90% of the observations fall. Because the percentiles are estimated independently for the three cover types, the 10th percentiles represent the low end of the measurements for the three covers, which may have been observed at different times of a year. Simiarly, the 90th percentiles respresent the high end of the measurements for the three covers, which may have occured at different times.
The 10th, 50th, and 90th percentiles represent low, median and high values in a distribution that are robust against outliers. These values can be used separately or combined to understand the land cover dynamics. For example, the three percentiles for the green cover fraction can serve as proxies for the minimum, typical and maximum green cover for a given year. Difference between the 10th and 90th percentiles provides an estimate of the magnitude of change within a year. A large range of values may be observed in the agricultural land for all cover types while high green cover and a small difference between 10th and 90th percentiles are expected for forest cover.
A representative view of the landscape in a year can be obtained by combining the 50th percentiles, or the median values, for the three cover types.