Web Services for GIS
Web Map Service / Web Coverage Service
A Web Map Service (WMS) is an Open Geospatial Consortium (OGC) standard that allows users to remotely access georeferenced map images via secure hypertext transfer protocol (HTTPS) requests.
DE Africa provides two types of maps services:
Web Map Service (WMS) - A standard protocol for serving georeferenced map images over the internet that are generated from a map server using data from a GIS database. It is important to note that with a WMS, you are essentially getting an image of geospatial data (i.e. JPG, GIF, PNG file). While this has its uses, it is an image only, and therefore does not contain any of the underlying geospatial data that was used to create the image.
Web Coverage Service (WCS) - A standard protocol for serving coverage data which returns data with its original semantics (instead of just pictures) which may be interpreted, extrapolated, etc., and not just portrayed. Essentially, a WCS can be thought of as the raw geospatial raster data behind an image. Using a WCS, you can pull the raw raster information you need to perform further analysis.
Web Map Tile Service (WMTS) - A standard protocol for serving pre-rendered georeferenced map tiles over the internet, comparable to WMS. The primary distinction between WMS and WMTS is how data is supplied to the client; WMS delivers map data as a single image, whereas WMTS serves map data as a series of tiles pre-rendered on the server side at different scales and cached on the client-side resulting in faster delivery and less bandwidth.
So, to give a quick summarisation, a WMS is simply an image of a map. You can almost think of this like taking a screenshot of Google Maps. A WMTS is identical to a WMS, except that the images are pre-generated and saved as small map tiles that span the whole map area and at several scales. A WCS is the raw raster data, so for example, if you are working with a WCS containing Landsat imagery, you can effectively chunk off the piece you are interested in and download the full multispectral image at the spatial resolution of the original image. The beauty of these services is that you can grab only the information you need. So, rather than retrieving a file that contains the data you are seeking and possibly much more, you can confine your download to only your area of interest, allowing you to get what you need and no more.
For more information, see this article on the difference between GIS web services.
The tutorials below cover:
Setting up WMS
Adding WMS-T (time-supported) layers
Connecting to WCS
Connecting to WMTS
The tutorials have been created with QGIS3 and ArcGIS Pro 3.0.3. The same processes can be used to connect other Desktop GIS applications. QGIS is a free and open-source desktop GIS application. You can download it from https://qgis.org/en/site/.
QGIS
Setting up WMS
This tutorial shows how to set up the Web Map Services in QGIS and use it with other data on your computer such as drone imagery, vector or raster data. This may be useful for you if you cannot upload the data to the DE Africa Map or the DE Africa Sandbox due to uploading due to size or internet bandwidth. It may also be useful if you feel more comfortable doing analysis in a GIS application.
Launch QGIS.
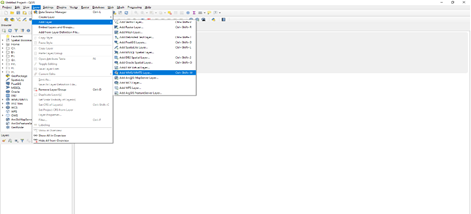
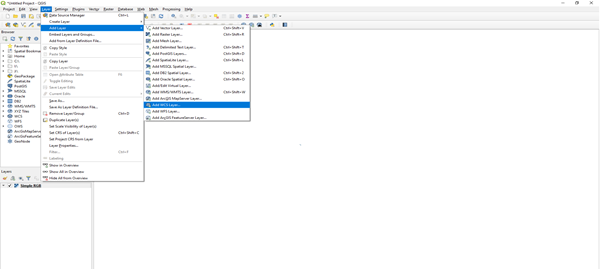
On the Menu Bar click on Layer.
A sub-menu tab will show below Layer; click on Add Layer, choose Add WMS/WMTS Layer.
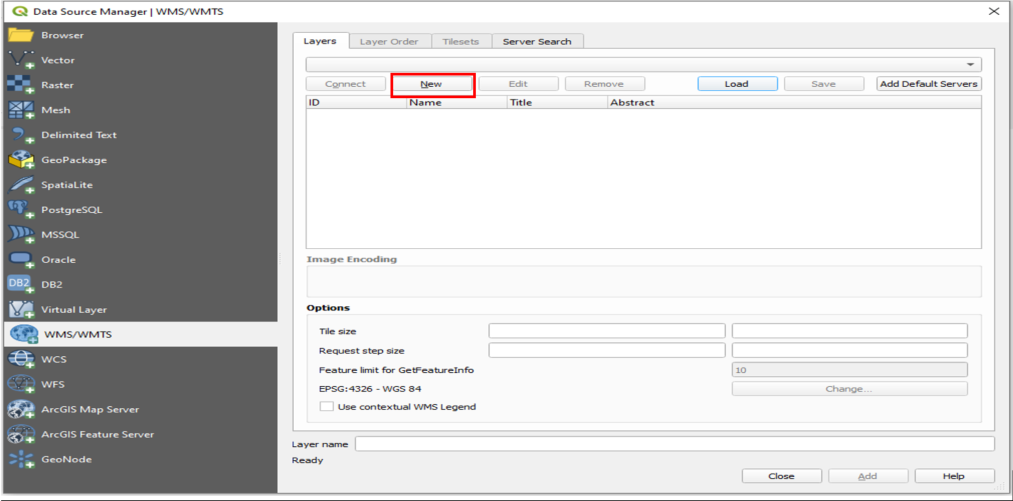
A dialogue will open as shown below. Click on the New button.
A dialogue will open, as shown below: Provide the following details, these can be found at the URL https://ows.digitalearth.africa/.
Name: DE Africa ServicesURL: https://ows.digitalearth.africa/wms?version=1.3.0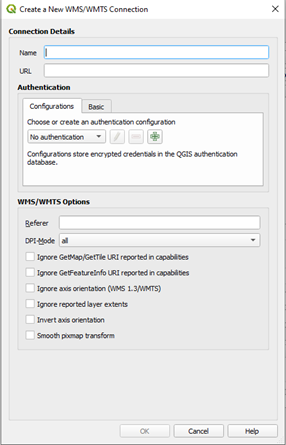
After providing the details above, click on OK.
The previous dialogue will show up, in the dropdown above the New button, you will see DE Africa Services. If it is not there click the dropdown button below and select it.
The Connect button will be activated, click on it to load the layers. Anytime this page is open, because the connection has already been established, click on Connect to load the data.
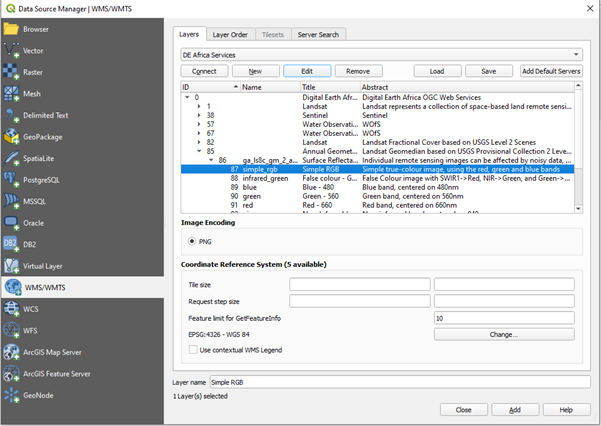
The layer will be loaded as shown below in the dialogue.
Navigate through layers and choose the layer you will need to display on the Map Page.
After selecting the layer, click on Add button at the bottom of the dialogue.
Close the dialogue, the selected layer will be loaded onto the Map Page.
For web developers
The sites below provide instructions on how to load these map services onto your platform.
https://leafletjs.com/examples/wms/wms.html
Add WMS-T (time-supported) layers
Digital Earth Africa web services support WMS-T (WMS with time). WMS-T layers allow users to navigate different time periods.
How to add WMS-T layers using QGIS
Connect to the Web Map Service in QGIS by following the instructions in Setting up WMS tutorial.
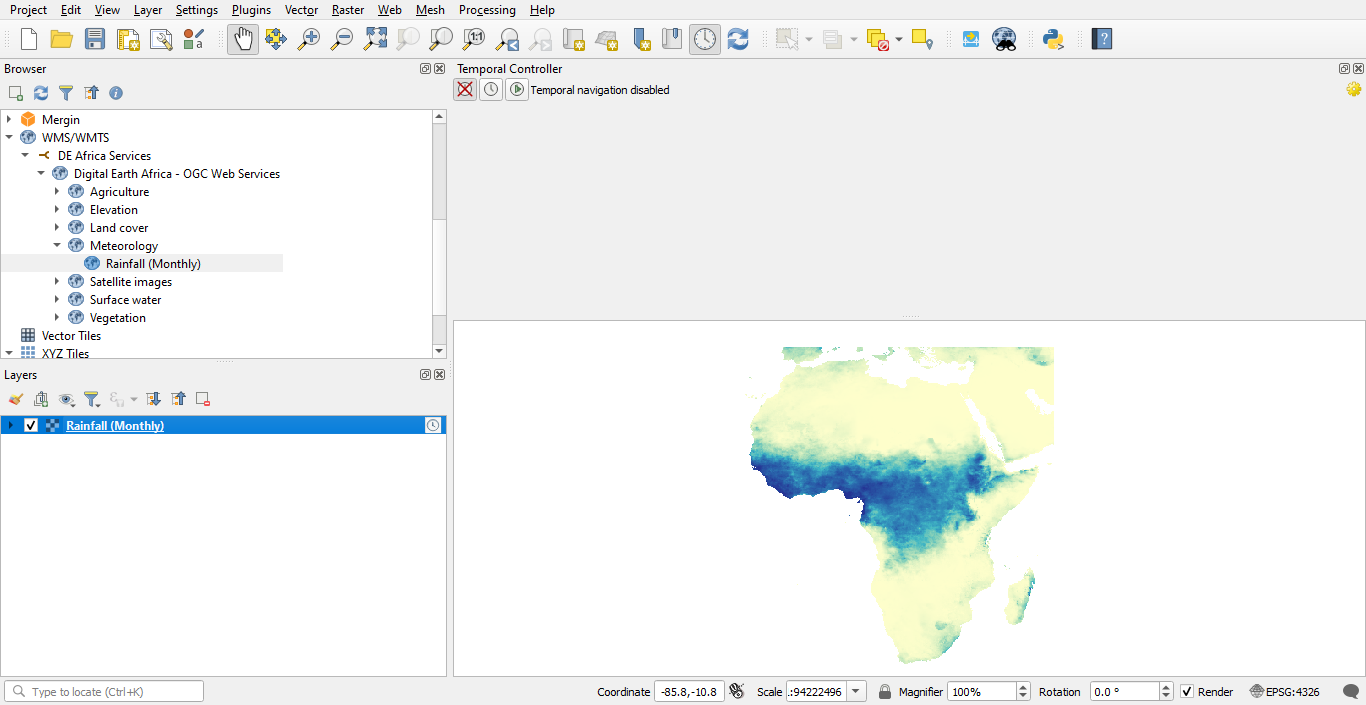
In the QGIS Browser Panel navigate to the WMS/WMTS provider item and expand it to show the DE Africa Services connection.
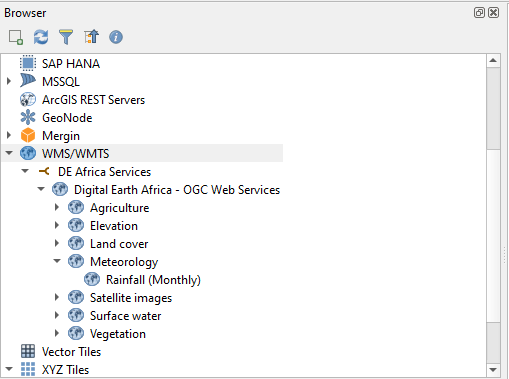
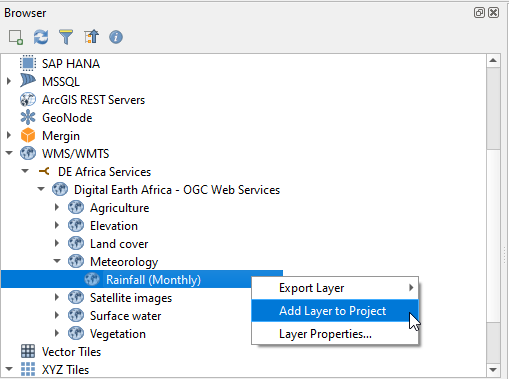
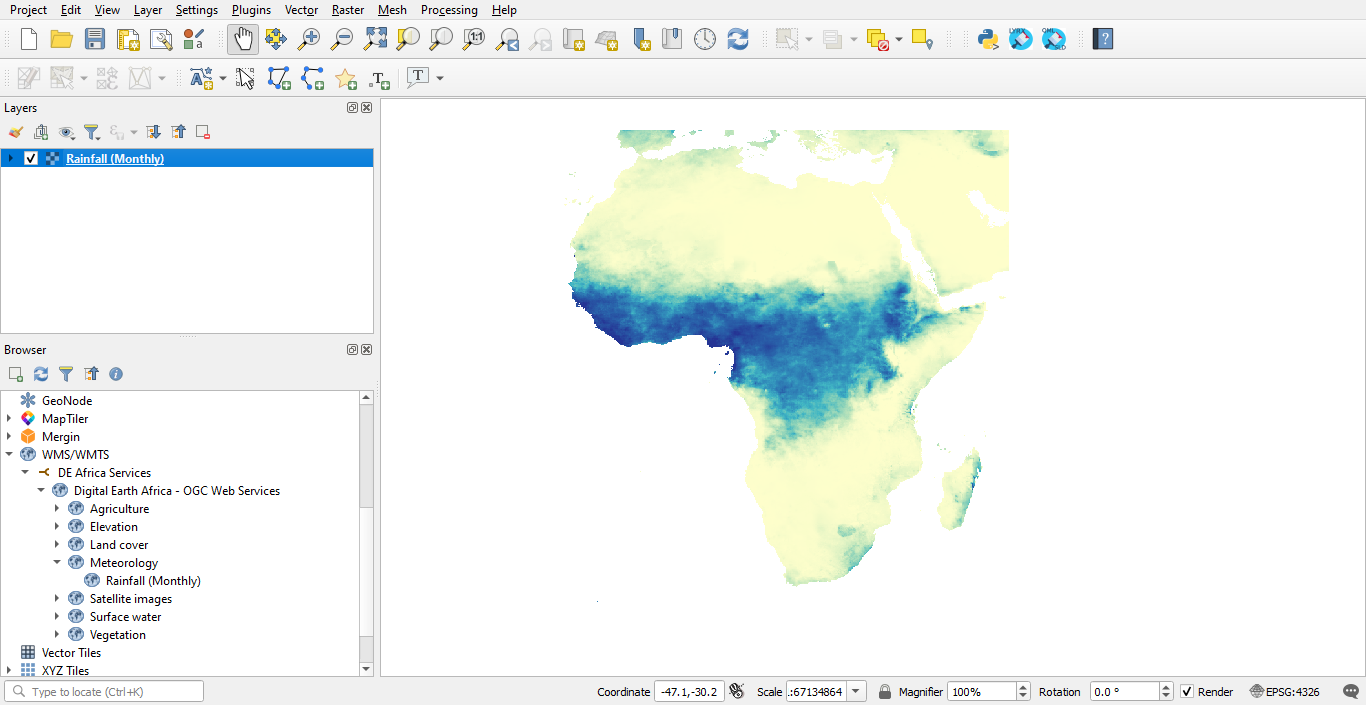
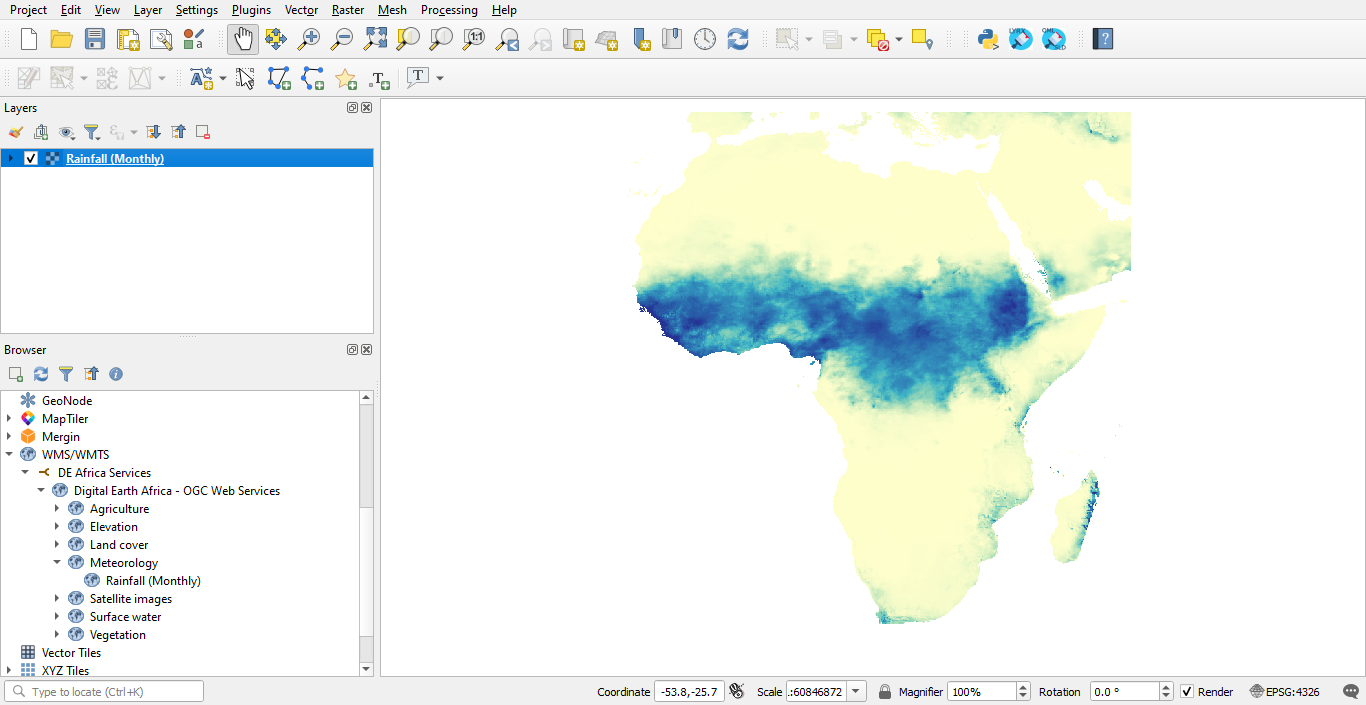
Select a WMS-T layer from the DE Africa Services connection layers by either double clicking on the layer item in the Browser Panel or right clicking on it and selecting Add Layer to Project to add the layer onto the map canvas.
The layer will be loaded in the Layers Panel with a clock symbol
 next it to indicate that it is a temporal layer.
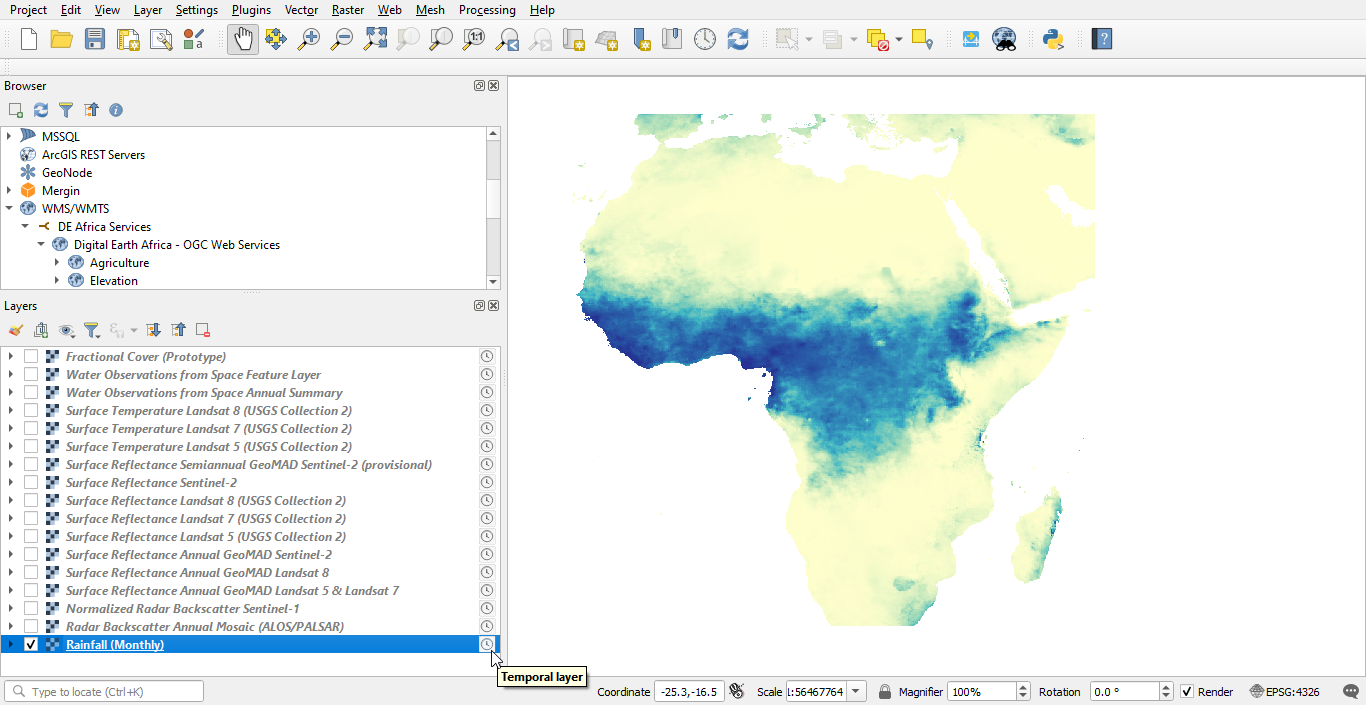
How to use the QGIS Temporal Controller with WMS-T layers
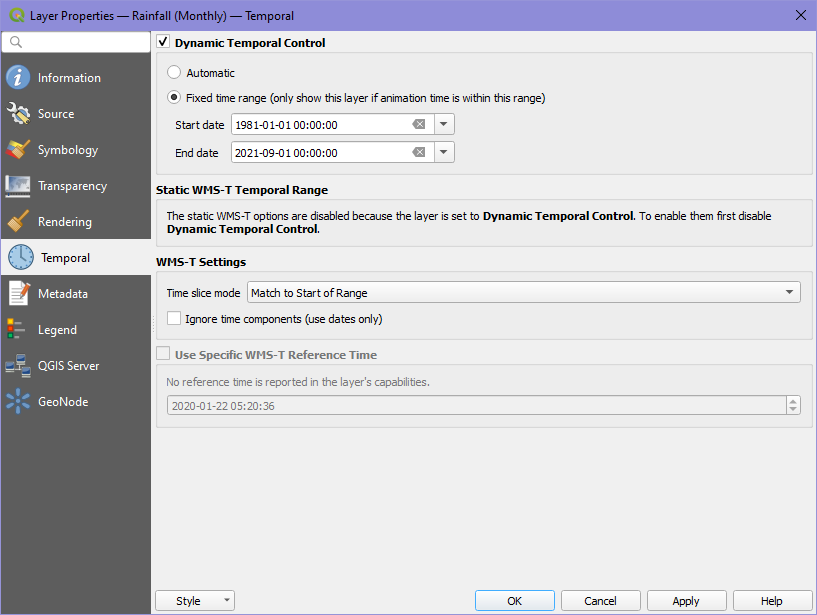
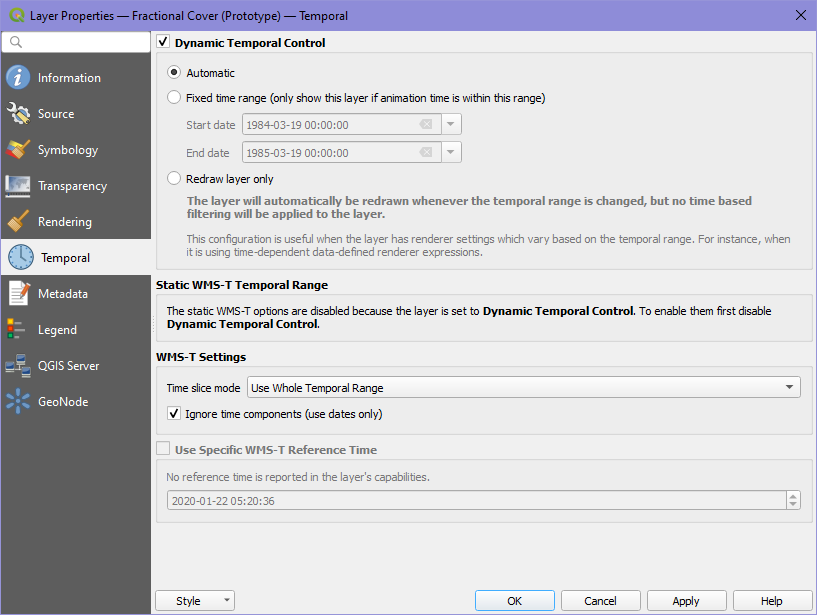
To use the Temporal Controller for WMS-T layers, ensure that in the Temporal section of the layer’s Layer Properties, the Dynamic Temporal Control is selected. You can select the time range to be Automatic or Fixed time range.
For the Automatic setting, the temporal handling is delegated to the data provider and time based filtering is applied to the features of the layer such that the features will be visualized for the animation range set by the Temporal Controller.
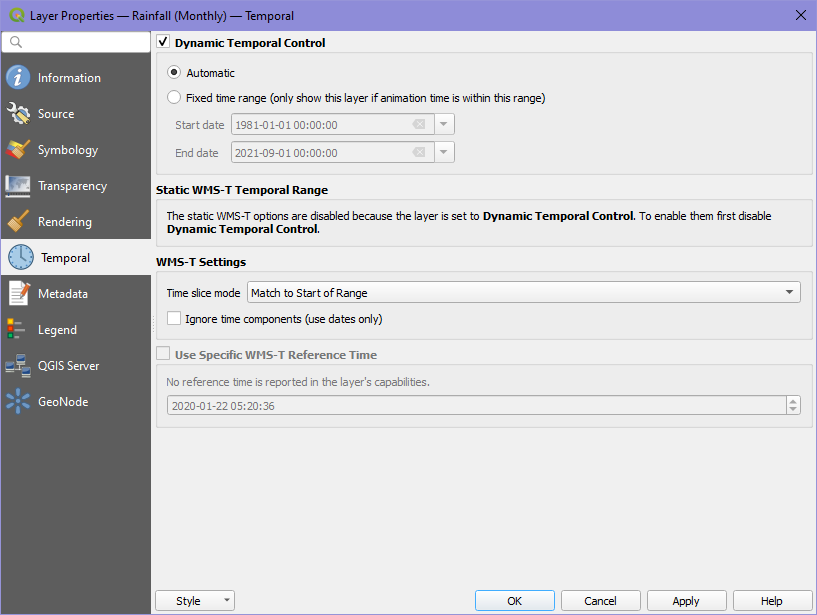
For the Fixed time range setting the user manually sets the temporal range in which all the features of the layer will be visualised only if the animation range from the Temporal Controller is within this temporal range.
On the Map Navigation Toolbar select the clock symbol for the Temporal Controller Panel to activate the Temporal Controller dock widget.
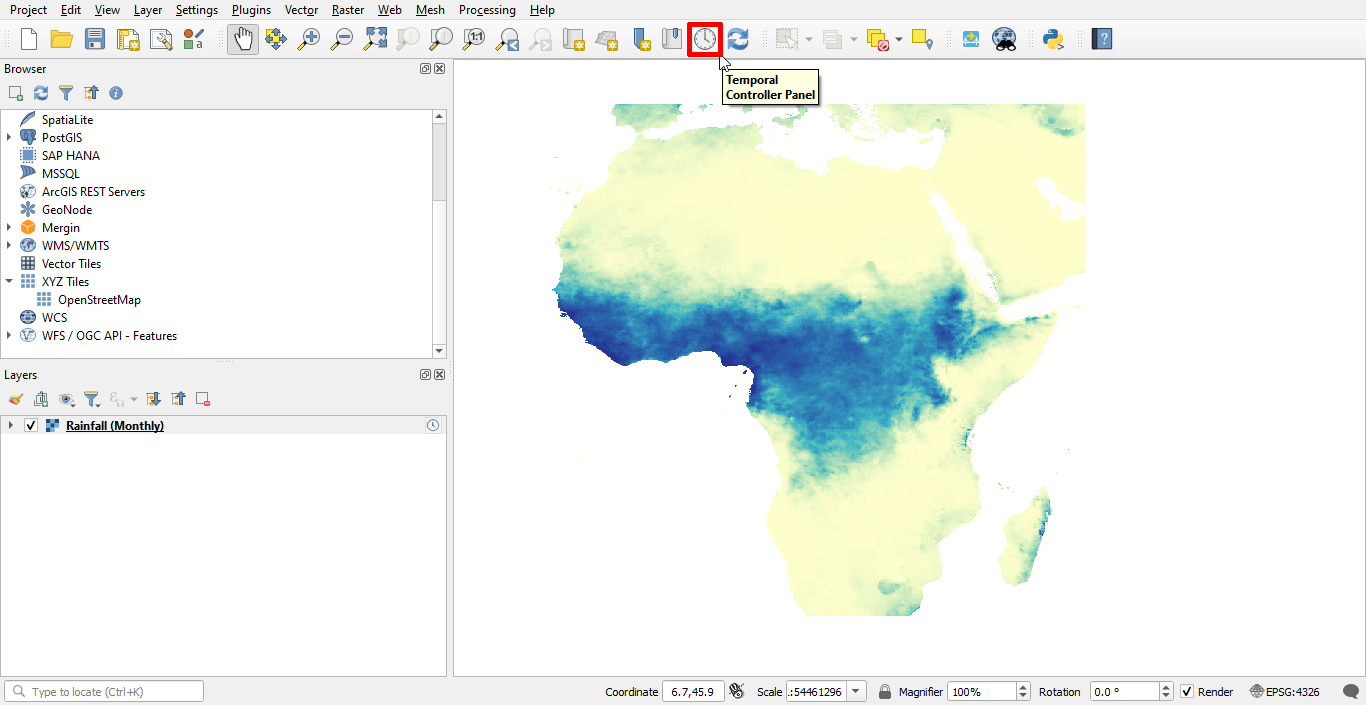
Temporal controller dock widget activated after click on the Temporal Controller toolbar icon.
To turn on the Fixed range temporal navigation, select the Fixed range temporal navigation icon
 on the Temporal Controller Panel and set the time range for the layer features to be visualized.
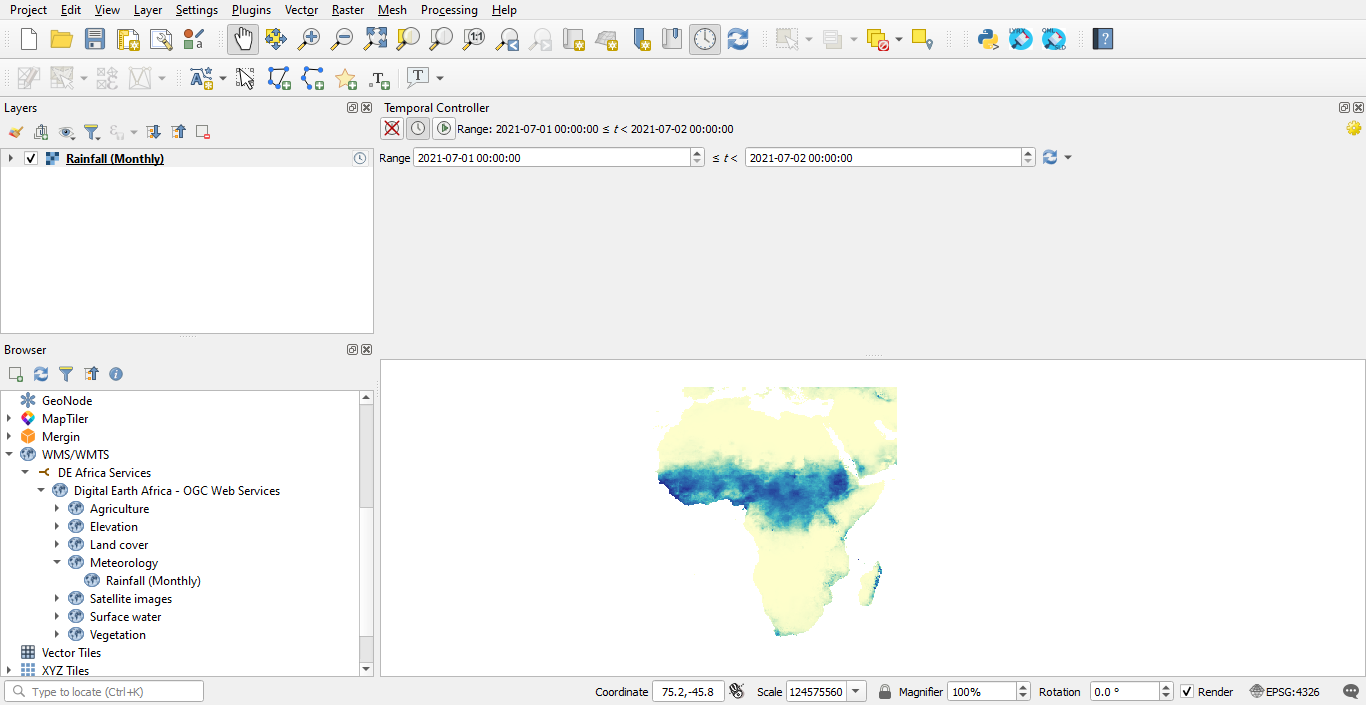
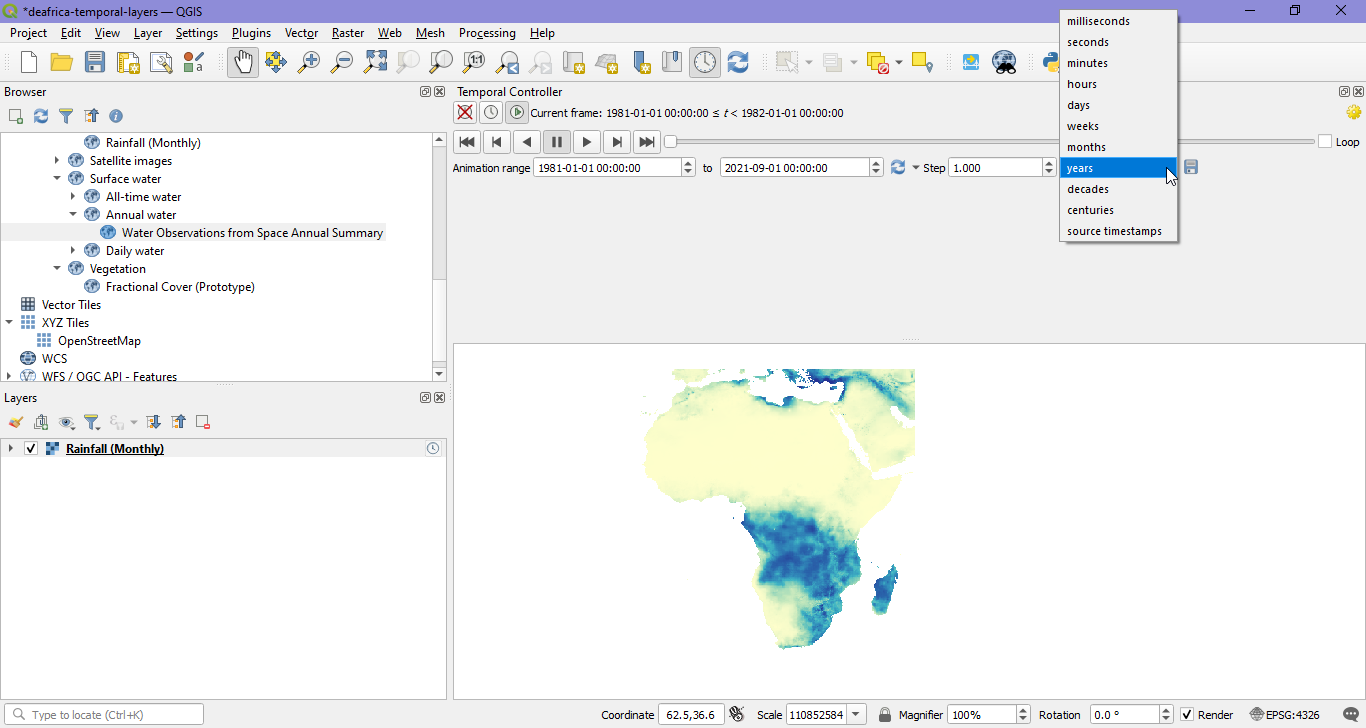
To turn on the Animated temporal navigation, select the Animated temporal navigation icon
 on the Temporal Controller Panel, and set animation range and the time step for the animation.
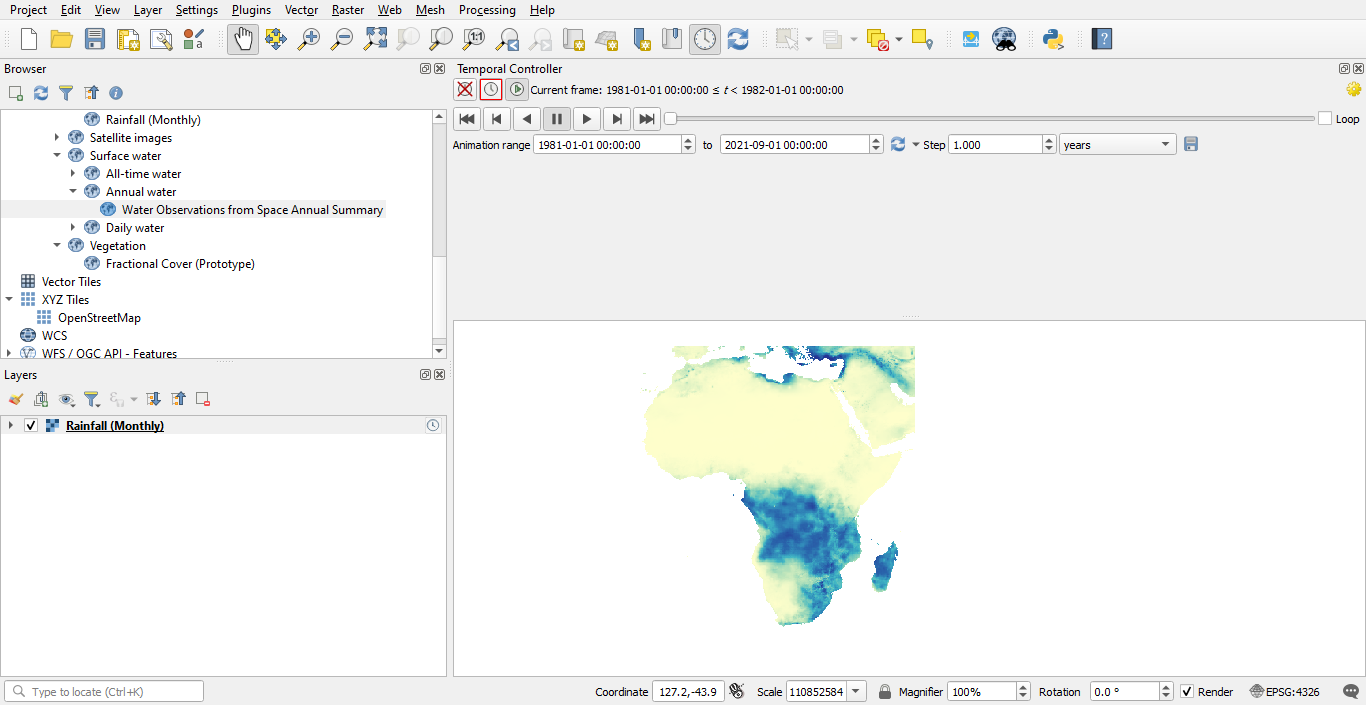
Click on the Play icon
 to view the animation.
To rewind the animation to the beginning i.e. the start of the animation range, click on the Rewind to start icon
 .
.
To go back to the previous frame of the animation, click on the Go to previous frame icon
 . The time difference (time step) between consecutive frames is determined by the Step defined by the user.
To rewind the animation, click on the Reverse icon
 .
.
To go to the next frame of the animation, click on the Go to next frame icon
 . The time difference (time step) between consecutive frames is determined by the Step defined by the user.
To fast forward the animation to the end i.e. skip to the end of the animation range, click on the Fast forward to end icon
 .
.
How to export the animation from QGIS Temporal Controller
The animation can be exported from the QGIS temporal controller as a series of images. To export the animation click on the Export animation icon
 on the Temporal Controller Panel.
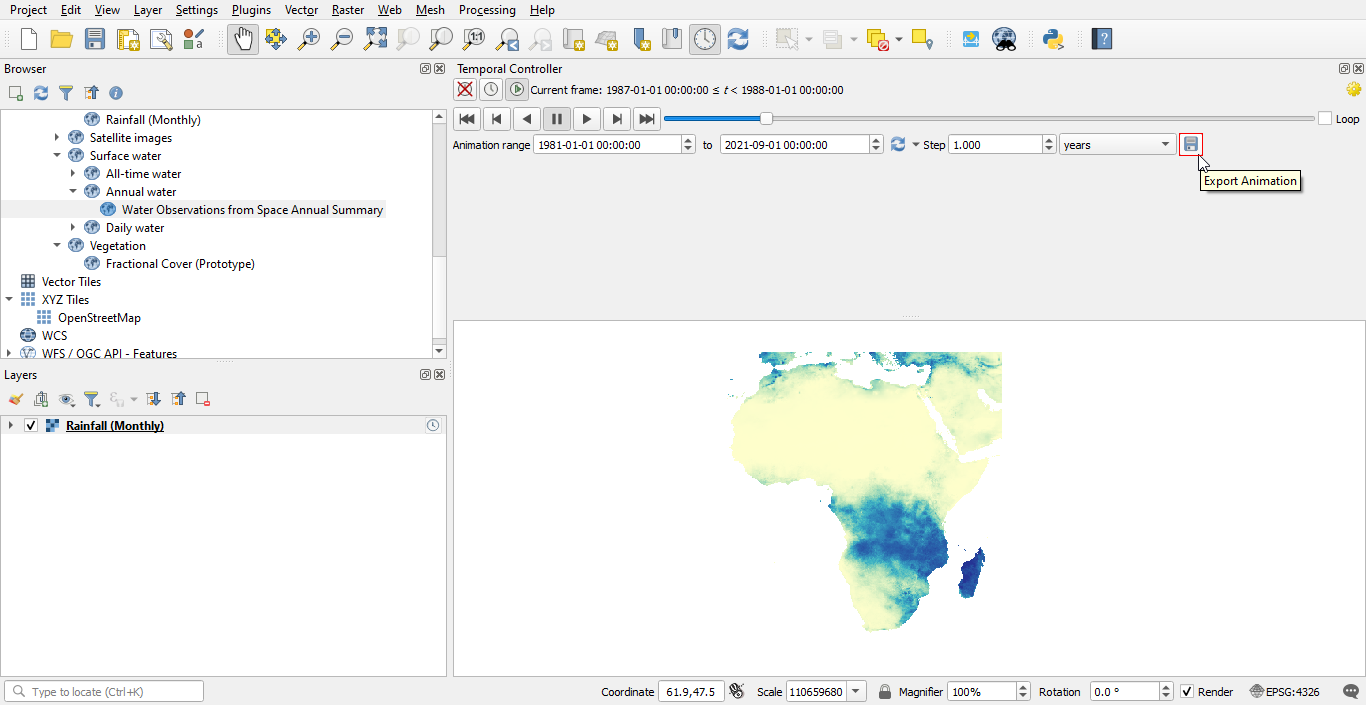
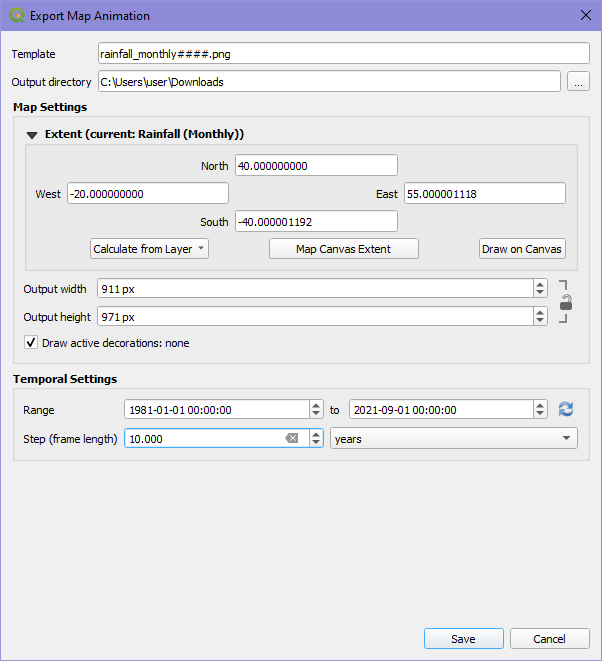
In the Export Map animation dialogue, specify:
The naming template to be used for labelling the images.
The output directory where the images will be saved.
The map extent to be covered by the images.
The width and height of the images.
The temporal range and time step for the animation.
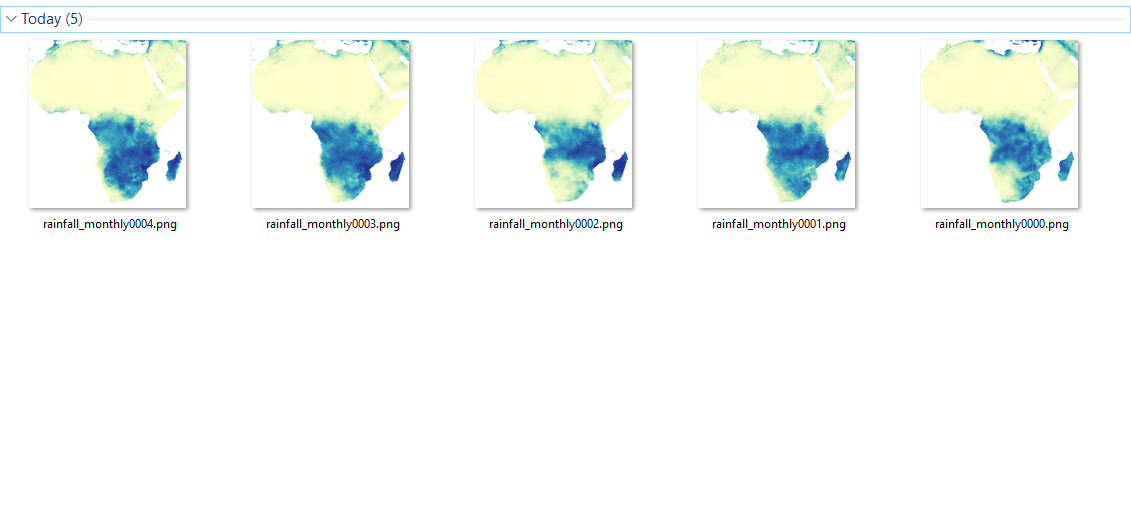
The exported images will be saved in the specified ouput directory. Using your preferred software, you can use the images to create an animation.
How to use the WMS-T layers in QGIS without the Temporal Controller
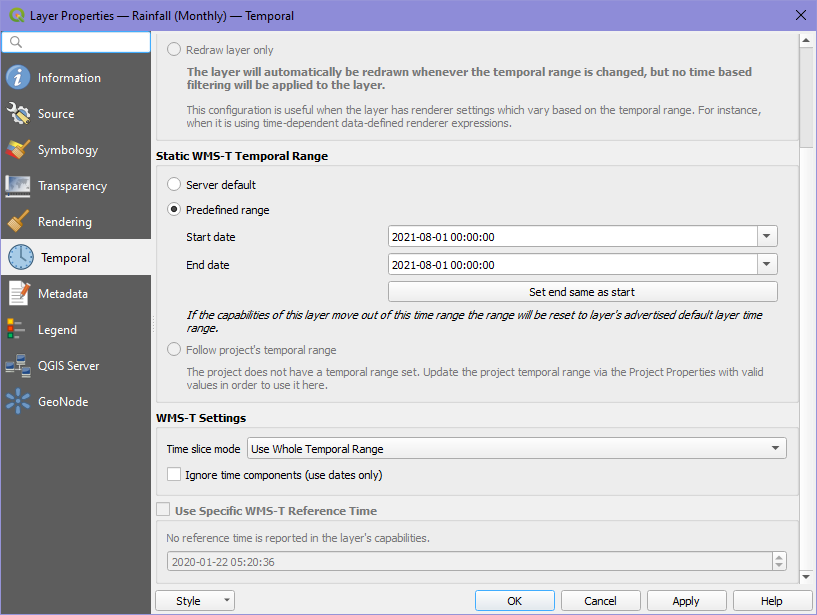
To use the WMS-T layers in QGIS without the Temporal Controller, first disable the Dynamic Temporal Control in the layer’s Layer Properties to enable the Static WMS-T Temporal Range settings. The default setting is the Server default temporal range for visualizing the layer features. This is a predefined temporal range set by the data service provider.
You will notice after disabling Dynamic Temporal Control that the layer no longer has the temporal indicator symbol
next to the layer name in the Layers Panel, this means that the layer is no longer considered a temporal layer by QGIS, hence can’t be used by the Temporal Controller.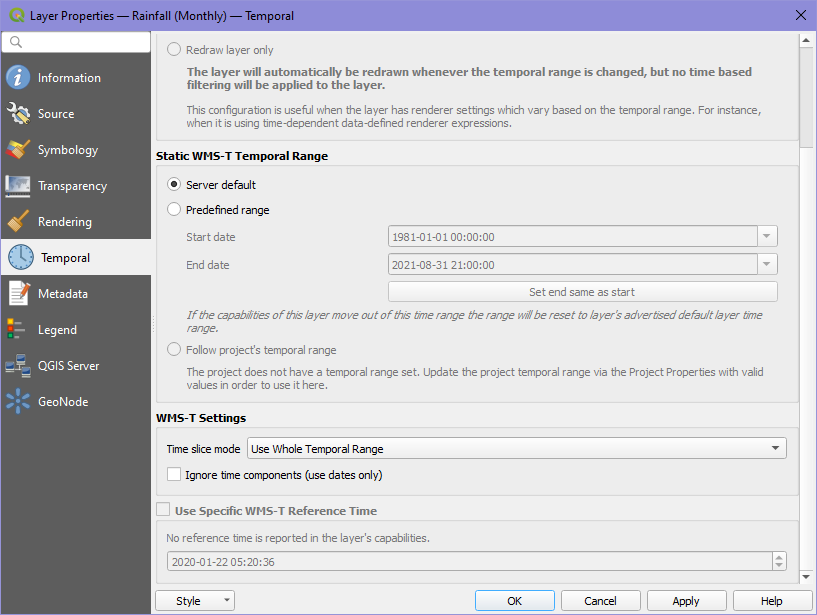
Using the Predefined range you can set the temporal range for the layer features to be visualized using the Start date and End date. A time-based filter will be applied to the layer and the fetched features will be the features within the predefined temporal range.
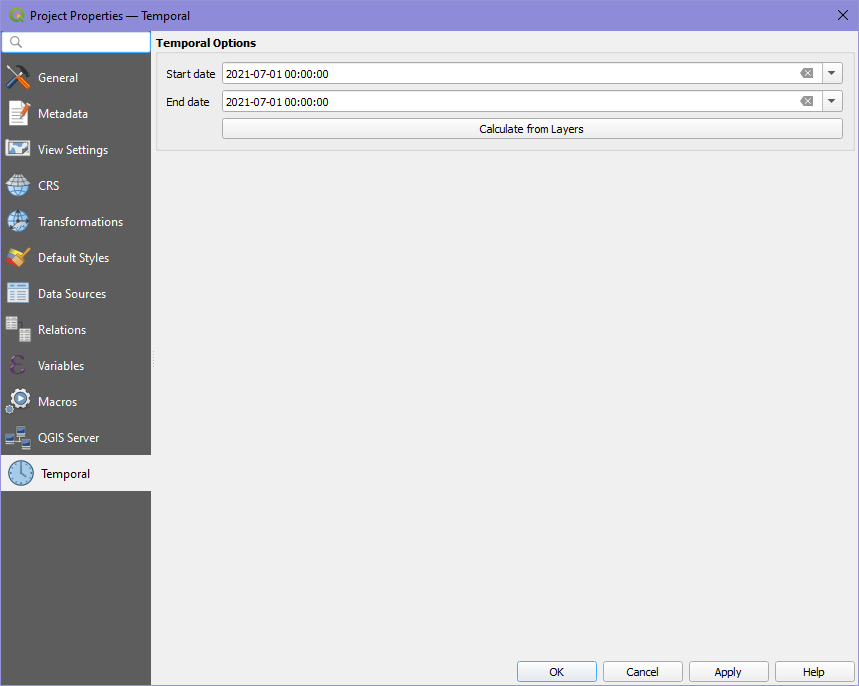
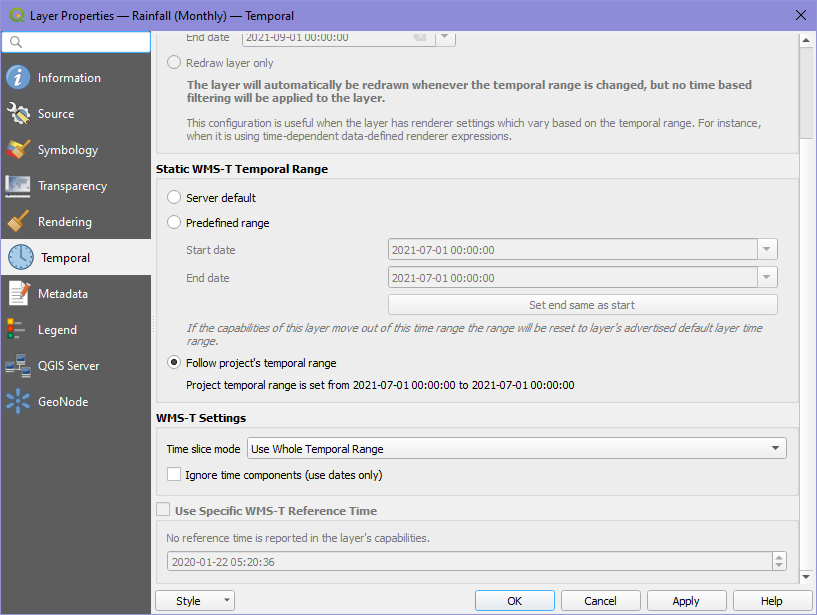
To use the Follow project’s temporal range setting, the project temporal range in the Temporal section (Project > Properties> Temporal) of the Project Properties must be set. After setting the project temporal range, applying this setting will result in fetching the WMS layer features that are within the projects temporal range.
WMS-T Settings
You can also specify the time slice mode used for both the Dynamic Temporal Control and the Static WMS-T Temporal Range. There are four options available for the time slice mode:
Use Whole Temporal Range: Allows the user to set the temporal range for the layer features to be visualized/plotted.
Match to Start of Range: The layer features visualized will be features that match the start of the layer’s time range.
Match to End of Range: The layer features visualized will be features that match the end of the layer’s time range.
Closest Match to Start of Range: Visualizes the layer features whose date and time stamp are the closest to the start of the defined temporal range.
Closet Match to End of Range: Visualizes the layer features whose date and time stamp are the closest to the end of the defined temporal range.
You can also enable the option for Ignoring time components which allows QGIS to only consider the dates when applying a time based filter to the layer features based on a defined temporal range, without considering the time component.
How to connect WCS
Launch QGIS.
On the Menu Bar click on Layer.
A sub-menu tab will show below Layer; click on Add Layer, choose Add WCS Layer.
Click on the New button.
A dialogue will open, as shown below: Provide the following details, these can be found at the URL https://ows.digitalearth.africa/
Name: DE Africa ServicesURL: https://ows.digitalearth.africa/wcs?version=2.1.0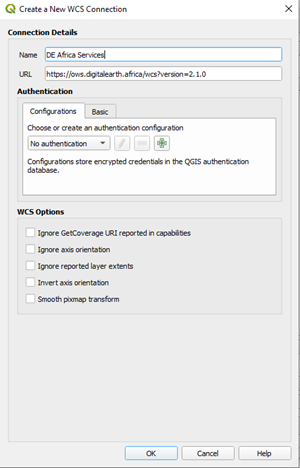
After providing the details above, click on OK.
The previous dialogue will show up, in the dropdown above the New button, you will see DE Africa Services, if it is not there click the dropdown button below and select it.
The Connect button will be activated, click on it to load the layers. Anytime this page is open, because the connection has already been established, click on the Connect button to load the data.
The layer will be loaded as shown below in the dialogue.
Navigate through layers and choose the layer you will need to display on the Map Page. With WCS you can select Time and Format of Image.
After selecting the layer click on the Add button at the bottom of the dialogue.
ArcGIS Pro
Setting up WMS
This tutorial shows how to set up the Web Map Services in ArcGIS Pro, and use it with other data on your computer such as drone imagery, vector or raster data. This may be useful for you if you cannot upload the data to the DE Africa Map or the DE Africa Sandbox due to uploading due to size or internet bandwidth. It may also be useful if you feel more comfortable doing analysis in a GIS application.
Launch ArcGIS Pro.
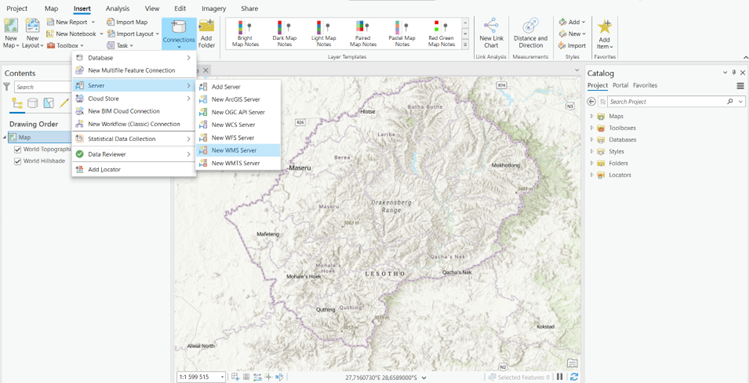
On the Menu Bar click on Insert.
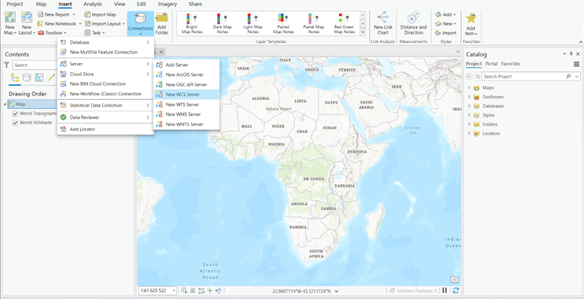
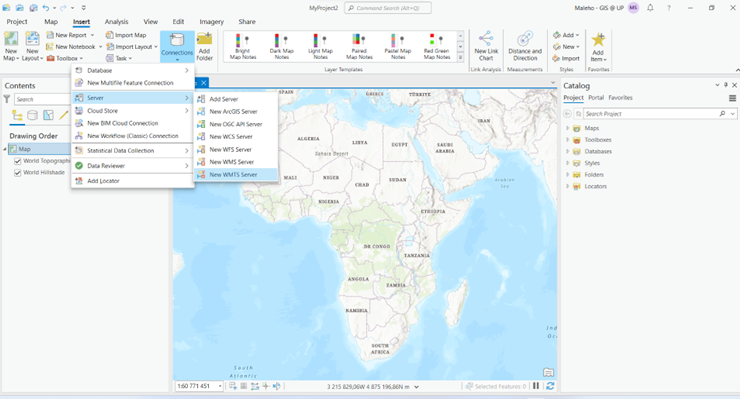
In the Project group, click on Connections and a dropdown menu will appear below Connections; click on Server and choose Add WMS Server.
A dialogue will open, as shown below: Provide the server URL, which can be found at the URL https://ows.digitalearth.africa/.
URL: https://ows.digitalearth.africa/wms?version=1.3.0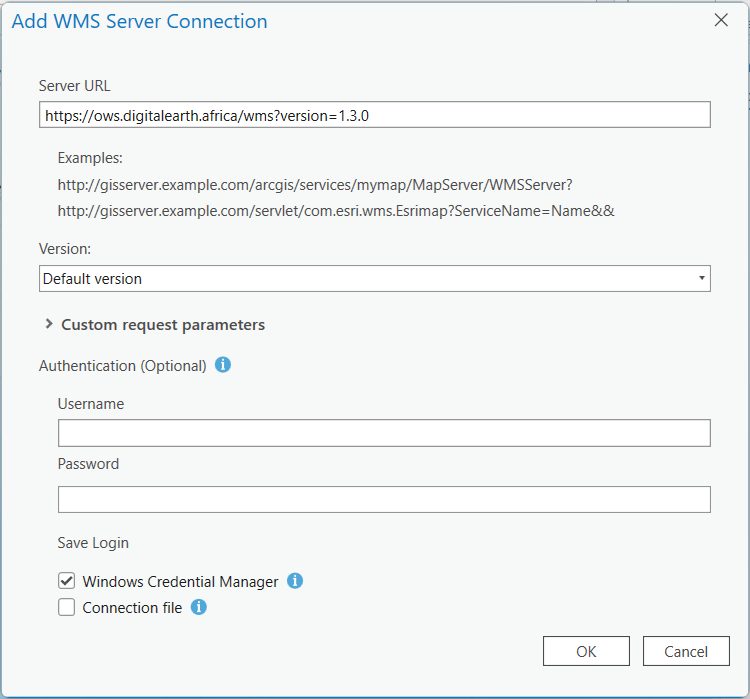
After providing the server URL above, click on OK.
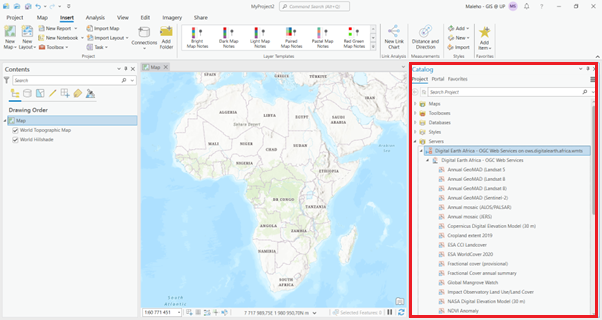
This will add the Digital Earth Africa WMS Server to the Catalog pane, under Servers.
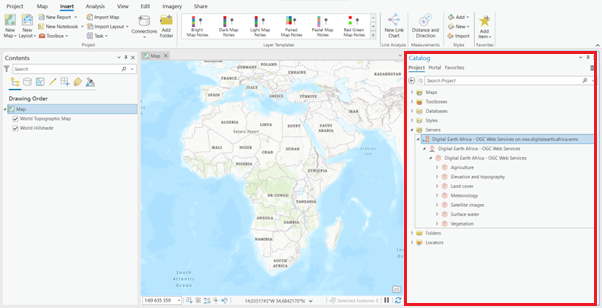
Navigate through layers and choose the layer you will need to display on the Map view.
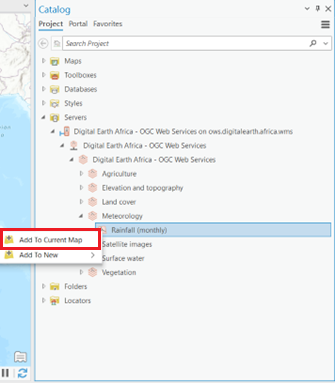
After selecting the layer, right click on the layer and select Add to Current Map (alternatively, you can drag and drop the layer onto the Map view).
The selected layer will be loaded onto the Map view.
For web developers
The sites below provide instructions on how to load these map services onto your platform.
https://leafletjs.com/examples/wms/wms.html
Add WMS-T (time-supported) layers
Digital Earth Africa web services support WMS-T (WMS with time). WMS-T layers allow users to navigate different time periods.
How to add WMS-T layers using ArcGIS Pro
Connect to the Web Map Service in ArcGIS by following the instructions in Setting up WMS tutorial.
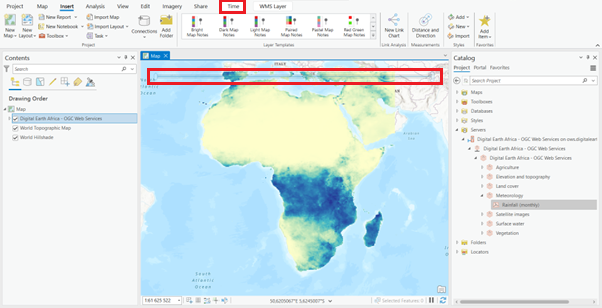
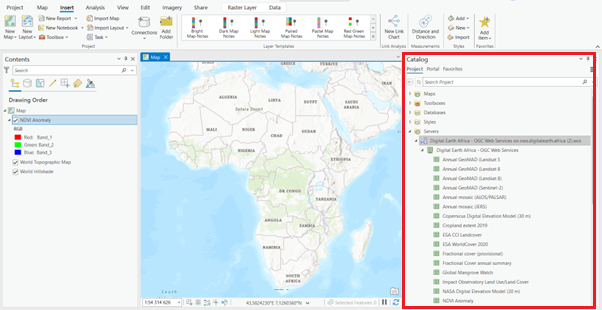
In the Catalog pane, navigate to Servers and expand it to show the Digital Earth Africa - OGC Web Services on ows.digitalearth.africa.wms connection.
Select a WMS-T layer from the Digital Earth Africa - OGC Web Services on ows.digitalearth.africa.wms connection layers. To add the layer to the map view, right click on the layer and select Add to Current Map (alternatively, you can drag and drop the layer onto the Map view).
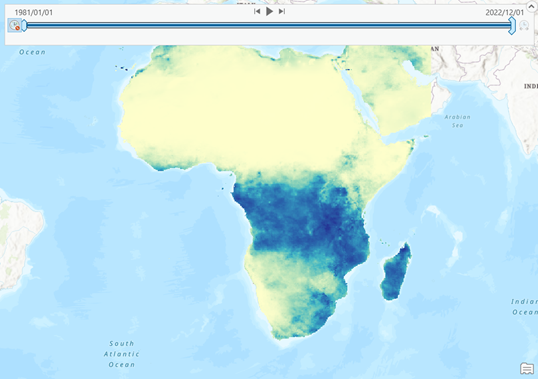
The layer will be loaded onto the Map view with a contextual Time tab added to the Menu bar and a Time Slider ay the top of the map view, indicating that it is a temporal layer.
How to use the ArcGIS Pro Time Slider with WMS-T layers
To use the Time Slider for WMS-T layers, hover over the Time Slider to see its controls.On the left side of the Time Slider icon, click on Time disabled
 to change it to Time enabled
  .
.
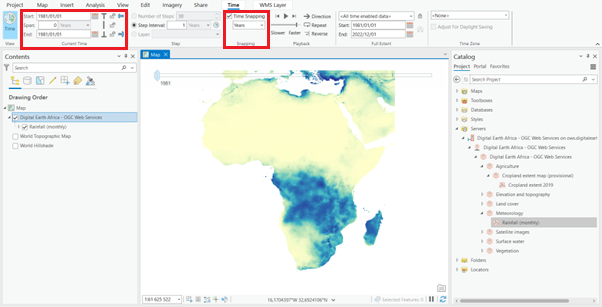
You can configure the time settings on your layer. Click on the Time tab in the Menu bar. In the Snapping group, check the Time Snapping check box.
Under the Time Snapping check box, click on the Time Snap Interval dropdown and select Years.
This corresponds to the yearly intervals of the data.
In the Current Time group, change the Span setting to 0 and press the Enter key.
This ensures that only one year’s woth of data displays at a time.
In the Playback group, click Play all steps
 .
.
To set the time slider controls backwards according to the step setting (i.e., move back one time step), click on the Step Back icon
 .
.
To set the time slider controls forward according to the step setting (i.e., move forward one time step), click on the Step Forward icon
 .
.
To set the relative speed of the visualisation by adjusting the amount of pause between steps, use the Adjust Playback Speed icon
 .
.
To set whether the playback of all steps begins by moving forward or backward in time through the data, click on the Direction icon
 .
.
To set the playback to continue to loop in the same direction after it has reached the last step at the end of the time slider, click on the Repeat icon
 .
.
To set the playback to continue to loop in the opposite direction after it has reached the last step at the end of the time slider, click on the Reverse icon
 .
.
How to export the animation from ArcGIS Time Slider
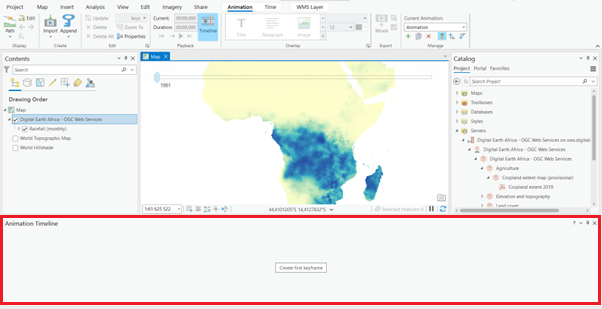
To export the animation, click on the View tab. In the Animation group, click Add.
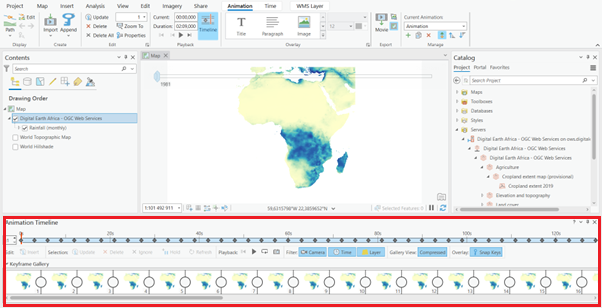
An empty Animation Timeline pane appers undeer the Map view. On the Menu bar, a contextual Animation tab appears.
Before you create keyframes for the animation, you will zoom to the correct map extent. In the Contents pane, right click on the layer and Zoom To layer.
On the Menu bar, click the Animation tab. In the Create group, click Impoer Animation and click Time Slider Steps.
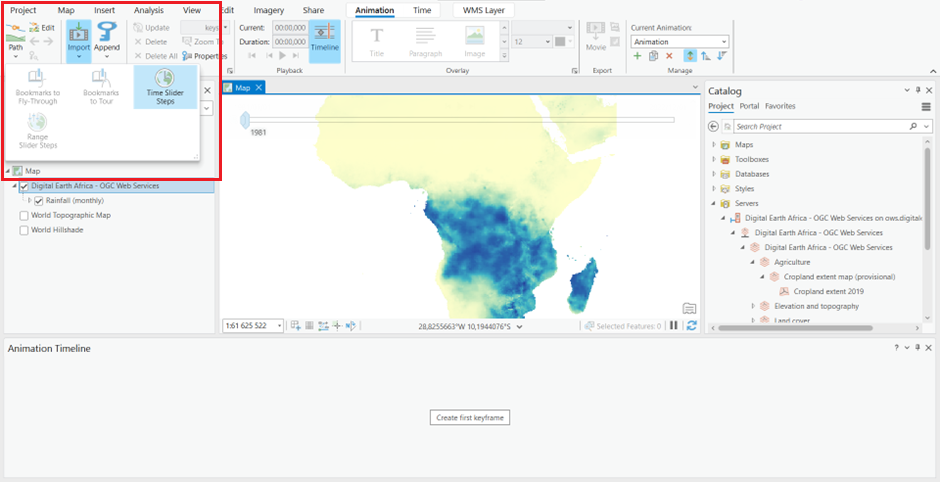
The Animation Timeline pane populates with keyframes (It takes a few moments for the images to display in the keyframes). The first keyframe represents the animation at zero seconds (00:00.0000). Each subsequent keyframe corresponds to the data for one year.
On the Animation tab, in the Playback group, the Duration setting tells you the length of the the animatiton. You can replace the duration value (e.g., 00:30 - which will make the duration of the animation 30 seconds).
As the animation plays, you may want to show which year the data represents. To do so, yo will add dynamic text - information that updates during the playback.
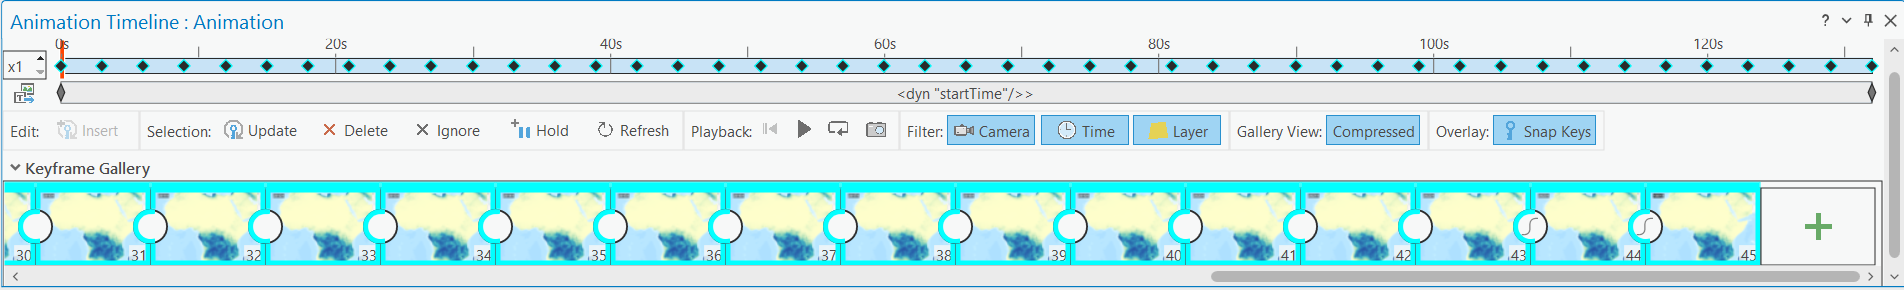
In the Animation Timeline pane, under keyframe Gallery, click on the first keyframe to select it and scroll to the end of the gallery, press and hold the Shift key, then click the last keyframe. This will select all the key frames in your animation.
The dynamic text you add in the next step will be applied to all the selected keyframes - in other words, thoughout the animation.
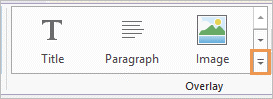
On the Menu bar, on the Animation tab, in the Overlay group, expand the Overlay gallery.
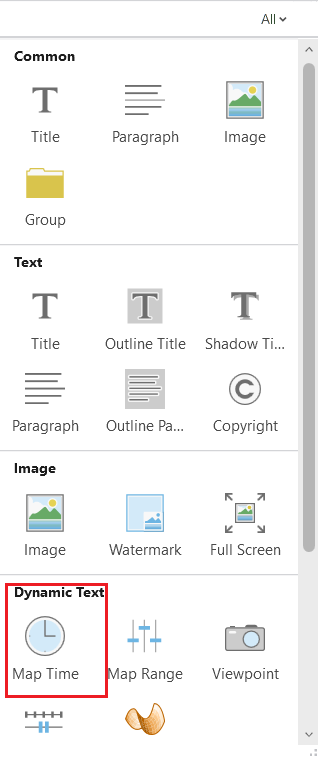
In the Overlay gallery, under Dynamic test, click Map Time.
- In the dynamic text box that appears on the Map view, replace the default two-line expression with
<dyn type="animation" property="startTime" format="yyyy"/>The expression created a single label, rather than a start and end time, and formats it display the year ratheer than a full date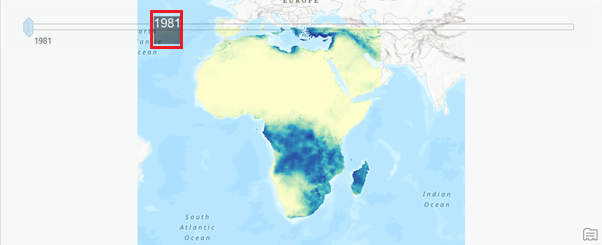
In the Playback group of the Animation tab, click on Play (Do not clickPlayon theTime Slideras the changes you have made to the animation are not reflected in theTime Slliderplayback.
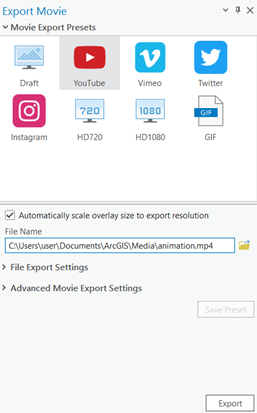
On the Animation tab, in the Export group, click Movie Export

In the Export Movie pane, in the File Name box, give your animation an appropriate name.
Optionally, click Browse
 and browse to a different folder to save the video.
Then click Export.
How to connect WCS
Launch ArcGIS Pro.
On the Menu Bar click on Insert.
In the Project group, click on Connections and a dropdown menu will appear below Connections; click on Server and choose Add WCS Server.
A dialogue will open, as shown below: Provide the server URL, which can be found at the URL https://ows.digitalearth.africa/.
URL: https://ows.digitalearth.africa/wcs?version=1.3.0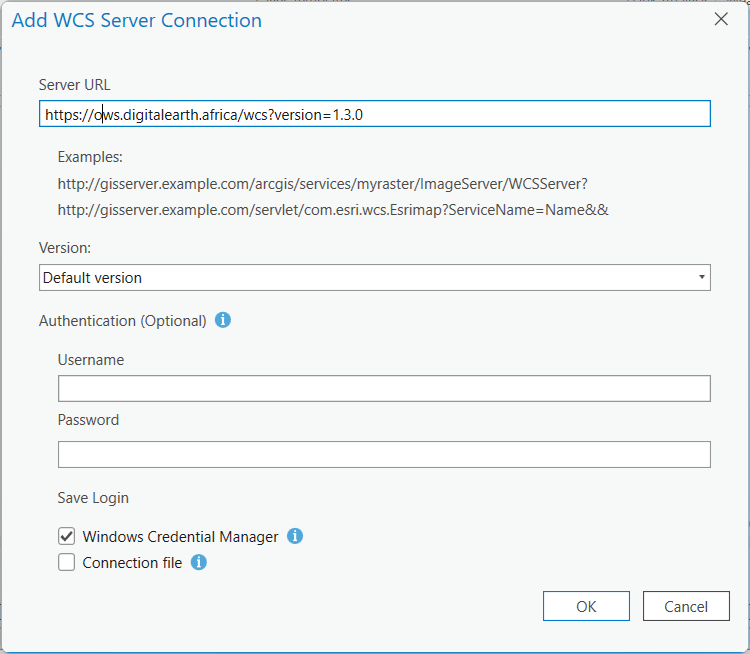
After providing the server URL above, click on OK.
This will add the Digital Earth Africa WCS Server to the Catalog pane, under Servers.
Navigate through layers and choose the layer you will need to display on the Map view.
After selecting the layer, right click on the layer and select Add to Current Map (alternatively, you can drag and drop the layer onto the Map view).
The selected layer will be loaded onto the Map view.
How to connect WMTS
Launch ArcGIS Pro.
On the Menu Bar click on Insert.
In the Project group, click on Connections and a dropdown menu will appear below Connections; click on Server and choose Add WMTS Server.
A dialogue will open, as shown below: Provide the server URL, which can be found at the URL https://ows.digitalearth.africa/.
URL: https://ows.digitalearth.africa/wmts?version=1.0.0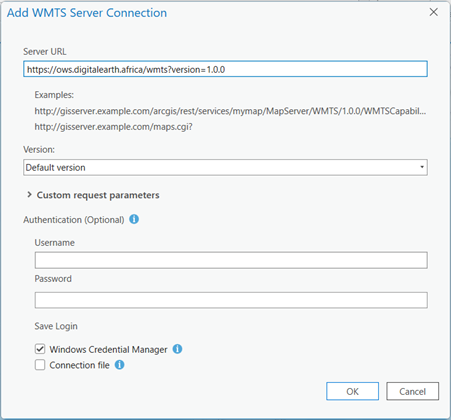
After providing the server URL above, click on OK.
This will add the Digital Earth Africa WMTS Server to the Catalog pane, under Servers.
Navigate through layers and choose the layer you will need to display on the Map view.
After selecting the layer, right click on the layer and select Add to Current Map (alternatively, you can drag and drop the layer onto the Map view).
The selected layer will be loaded onto the Map view.
[ ]: