Water Observations from Space
Date modified: 01 November 2024
Service overview
Background
Water Observations from Space (WOfS) is a service that uses satellite images to provide historical surface water observations across the African continent. WOfS enables users to understand the location and movement of inland and coastal water over time. It shows where water is usually present; where it is seldom observed; and where inundation of the surface has been observed by satellite.
The data are generated using the WOfS classification algorithm applied to Landsat satellite images. There are three WOfS products available in the collection for the African continent, as listed below:
Product Type |
Description |
|---|---|
WOfS Feature Layer (WOFL) |
Water and non-water classification generated per scene |
WOfS Annual Summary |
The ratio of wet to clear observations for each calendar year |
WOfS All-Time Summary |
The ratio of wet to clear observations for the full time period |
WOfS Feature Layer (WOFL): Individual water-classified images are called Water Observation Feature Layers (WOFLs), and are created from the input satellite data. There is one WOFL for each satellite image processed showing the occurrence of water.
WOfS Annual/All-Time Summary: The frequency of a pixel being classified as wet. This involves:
Total number of clear observations for each pixel: the number of observations that were clear (no cloud, cloud shadow or terrain shadow) for the selected time period. The classification algorithm then assigns these as either wet, or dry.
Total number of wet observation for each pixel: the number of observations that were clear and wet for the selected time period.
The WOfS summaries are calculated as the ratio of clear wet observations to total clear observations.
Specifications
Relevant coverage and metadata for each of the three WOfS products can be viewed on DE Africa Metadata Explorer:
A Jupyter Notebook which demonstrates loading and using WOfS products in the Sandbox is also available.
WOfS Feature Layer
Table 1: WOfS Feature Layer product specifications
Specification |
|
|---|---|
Product name |
WOfS Feature Layer |
Cell size - X (metres) |
30 |
Cell size - Y (metres) |
30 |
Coordinate reference system |
Universal Transverse Mercator (UTM) |
Temporal resolution |
16 days |
Temporal range |
1984 – present |
Parent dataset |
Landsat Collection 2 Surface Reflectance |
Update frequency |
Daily |
Table 2: WOfS Feature Layer measurements
Band ID |
Description |
Value range |
Data type |
No data value |
|---|---|---|---|---|
water |
WOFL water |
|
|
|
The WOFL measurement water uses bit flags to allocate terrain characteristics to each pixel. Bit flags assign a unique decimal value to each characteristic. A pixel can hold multiple characteristics by summing the decimal values of each associated bit flag.
Table 3: WOfS Feature Layer bit flags
Bit |
Flagging |
Decimal Value |
Description |
|---|---|---|---|
0 |
no data |
1 |
1 = pixel masked out due to NO_DATA in source, 0 = valid data |
1 |
non-contiguity |
2 |
At least one input band is missing or invalid |
2 |
low solar angle |
4 |
Solar incidence angle is less than 10 degrees |
3 |
terrain shadow |
8 |
Terrain shadow |
4 |
high slope |
16 |
Terrain slope (measured from SRTM) is larger than 12 degrees |
5 |
cloud shadow |
32 |
Cloud shadow |
6 |
cloud |
64 |
Cloud |
7 |
water observed |
128 |
Classified as water by the decision tree |
For example, a water value of 136 indicates water (128) AND terrain shadow (8) were observed for the pixel, whereas a value of 144 would indicate water (128) AND high slope (16).
WOFLs are useful for identifying the presence of water at a certain point in time, or over short durations (less than one year), and can be best utilised by people with knowledge of water observations with satellites, and their limitations. For annual or historical data, users can access the pre-calculated summary products detailed below.
WOfS Annual Summary
Table 4: WOfS Annual Summary product specifications
Specification |
|
|---|---|
Product name |
WOfS Annual Summary |
Cell size - X (metres) |
30 |
Cell size - Y (metres) |
30 |
Coordinate reference system |
EPSG: 6933 |
Temporal resolution |
Annual |
Temporal range |
1984 – 2023 |
Parent dataset |
WOfS Feature Layer |
Update frequency |
Annual |
Update latency |
2 months from end of previous year |
Table 5: WOfS Annual Summary measurements
Band ID |
Description |
Value range |
Data type |
No data value |
|---|---|---|---|---|
count_wet |
How many times a pixel was wet |
|
|
|
count_clear |
How many times a pixel was clear |
|
|
|
frequency |
Frequency of water detection at a location |
|
|
|
WOfS All-Time Summary
Table 6: WOfS All-Time Summary specifications
Specification |
|
|---|---|
Product name |
WOfS All-Time Summary |
Cell size - X (metres) |
30 |
Cell size - Y (metres) |
30 |
Coordinate reference system |
EPSG: 6933 |
Temporal resolution |
Single summary for the full temporal range |
Temporal range |
1984 – 2023 |
Parent dataset |
WOfS Feature Layer |
Update frequency |
Annual |
Update latency |
2 months from end of previous calendar year |
Table 7: WOfS All-Time Summary measurements
Band ID |
Description |
Value range |
Data type |
No data value |
|---|---|---|---|---|
count_wet |
How many times a pixel was wet |
|
|
|
count_clear |
How many times a pixel was clear |
|
|
|
frequency |
Frequency of water detection at a location |
|
|
|
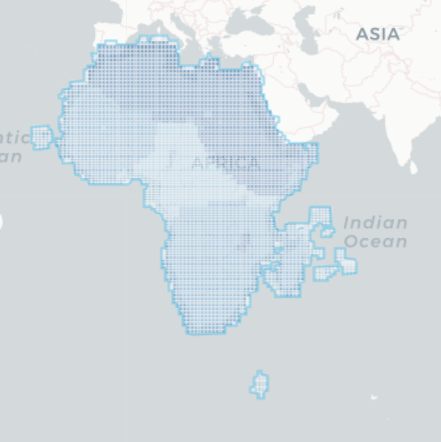
All products in the WOfS collection have the same geographic extent. This is shown in Figure 1; data are available for the regions shaded in blue. Specific temporal and geographic extents can be explored as an interactive map on the Digital Earth Africa Metadata Explorer. Different WOfS products can be selected from the horizontal dropdown menu at the top of the page.
Figure 1: Landsat WOfS colelction geographic extent
Processing
The Water Observations from Space Detection Algorithm as described in Mueller et al. (2016), is applied to the Landsat data to create the available WOfS products.
Media and example images
Image 1: Tagrin Bay, Sierra Leone. WOfS All-Time Summary.
Colours indicate the percentage of times water was detected. Red is “rarely water”, green is “often water”, and blue is “always water”.
Credit: U.S. Geological Survey Landsat data was used in compiling this image.
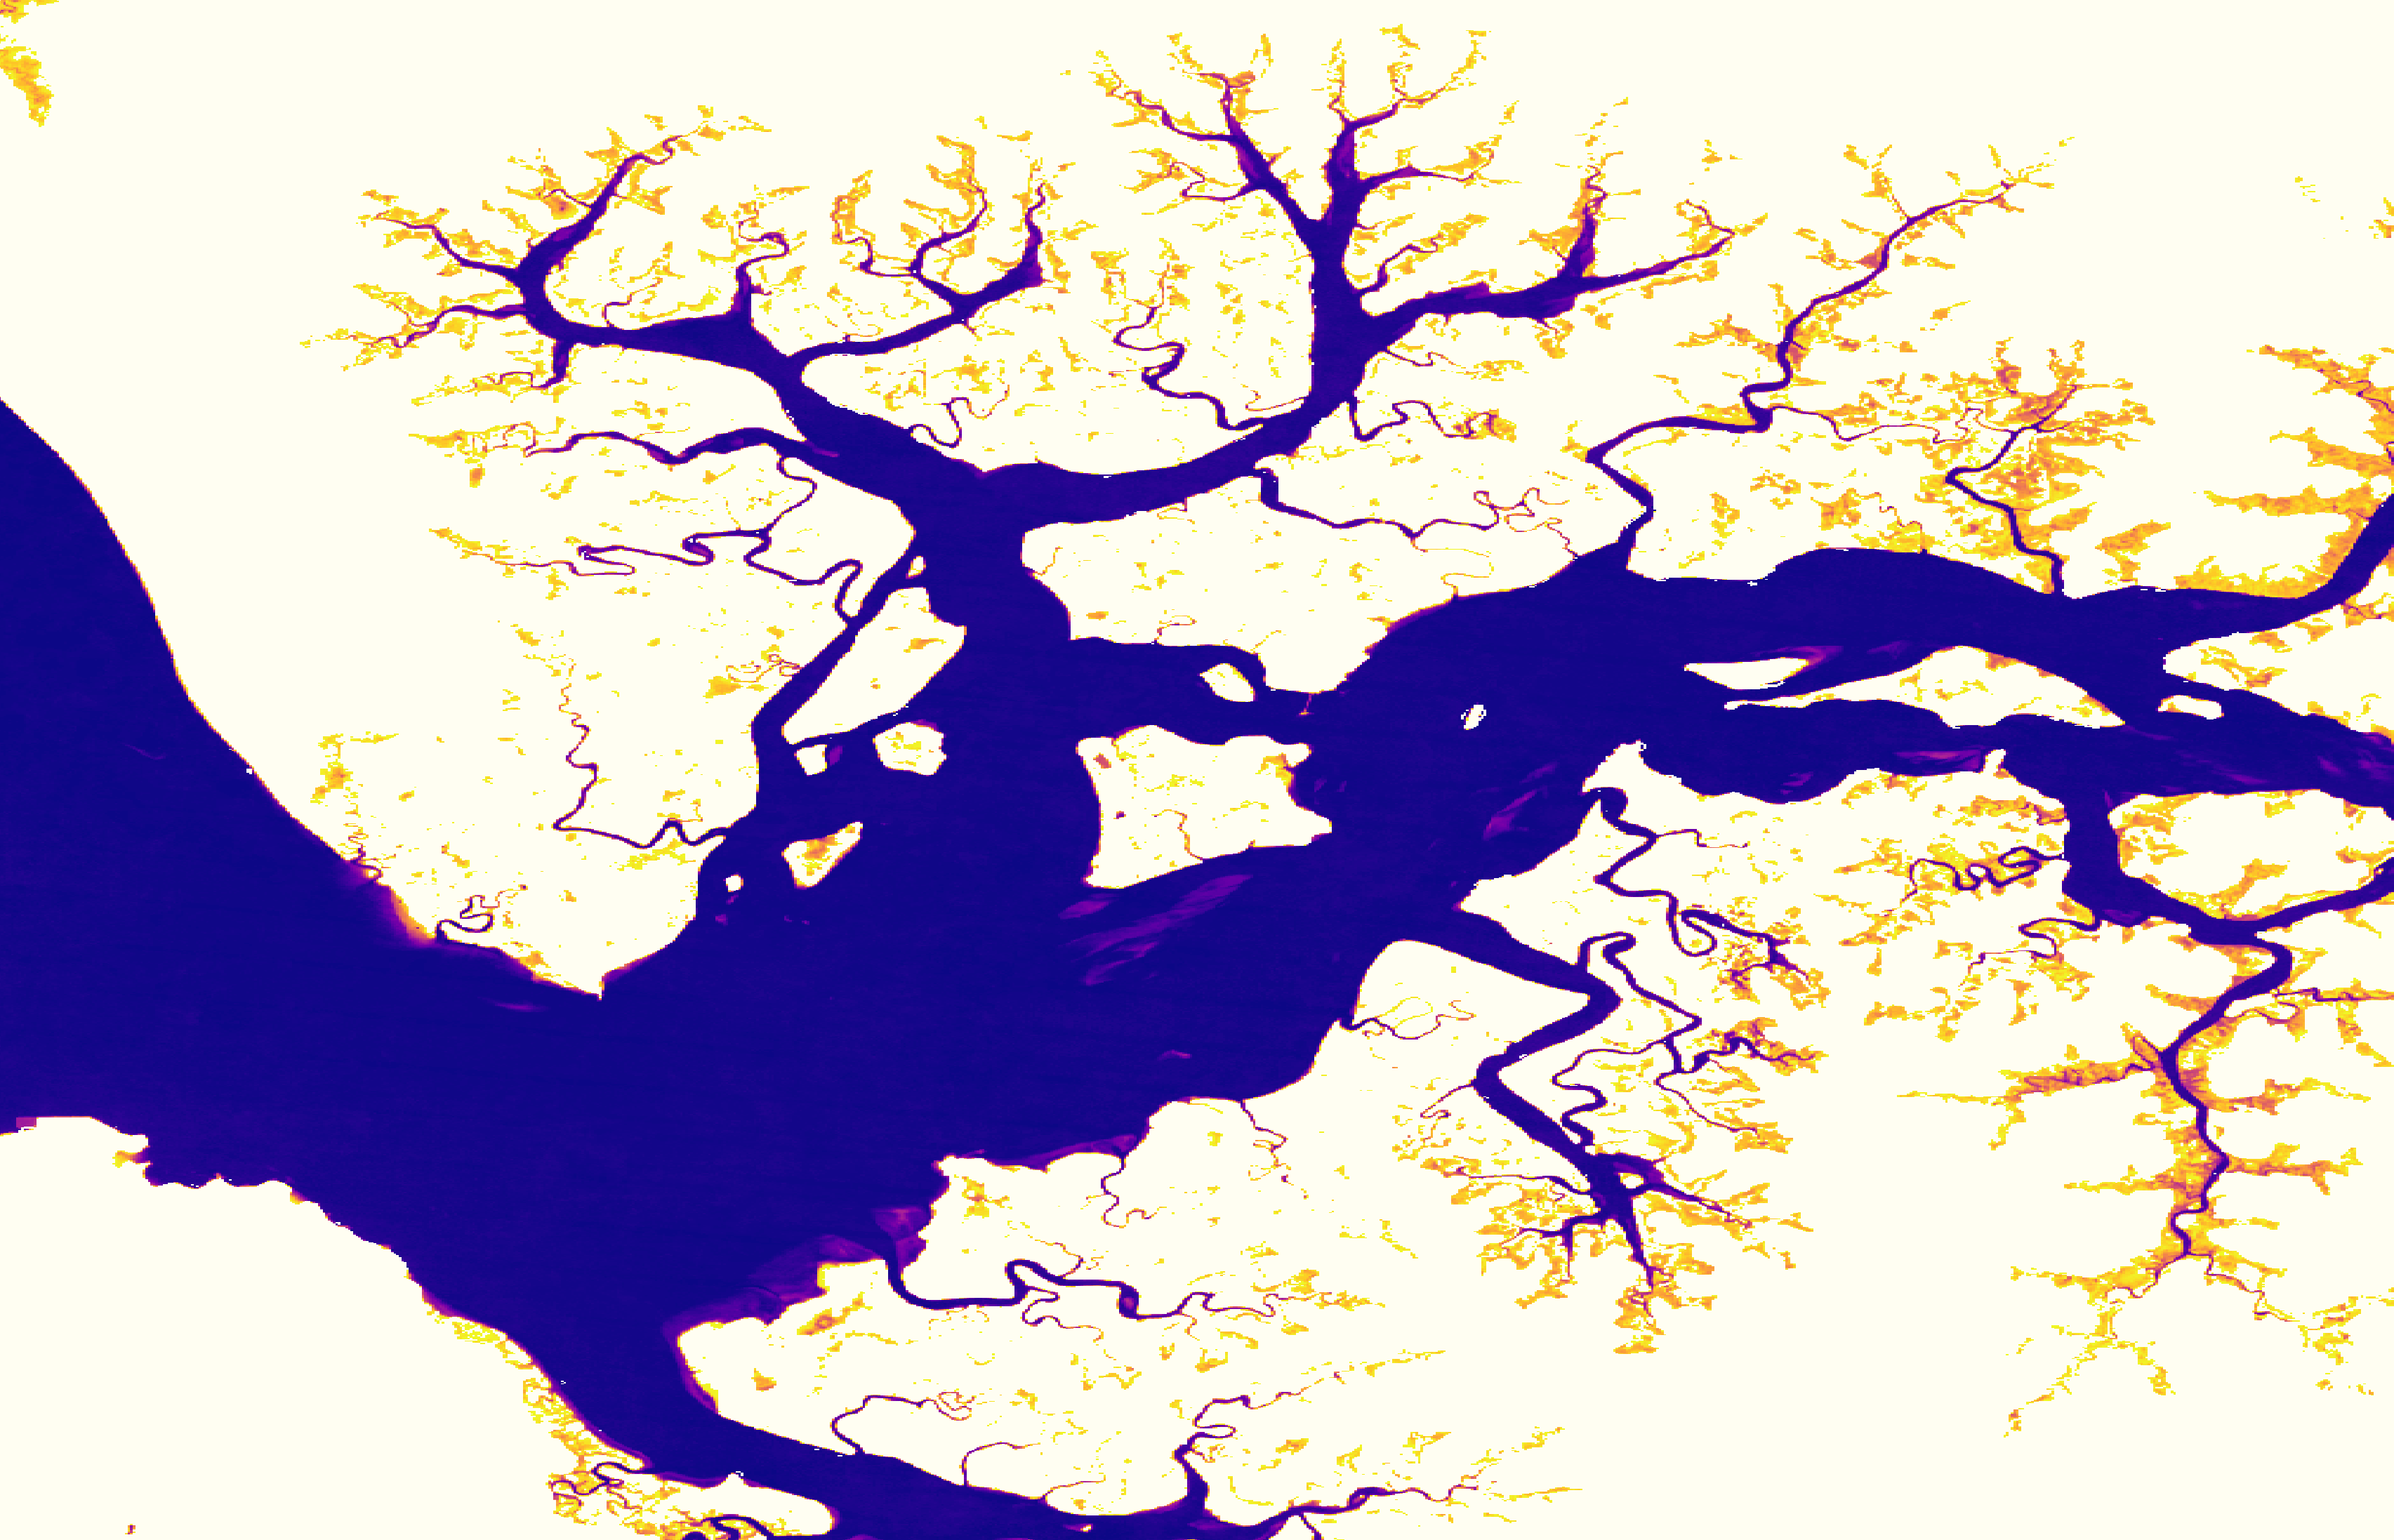
Image 2: Bui Dam inlet, Ghana. Animation of WOfS annual Summary from 2004 to 2021.
Intensity of colour indicates the percentage of times water was detected for that year. Dark blue is “always water”, while light blue is “rarely water”.
Credit: U.S. Geological Survey Landsat data was used in compiling this image.
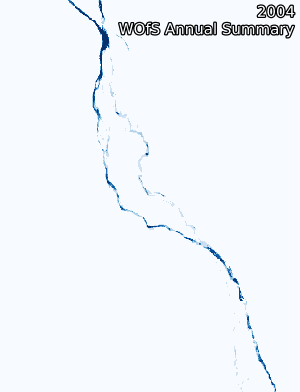
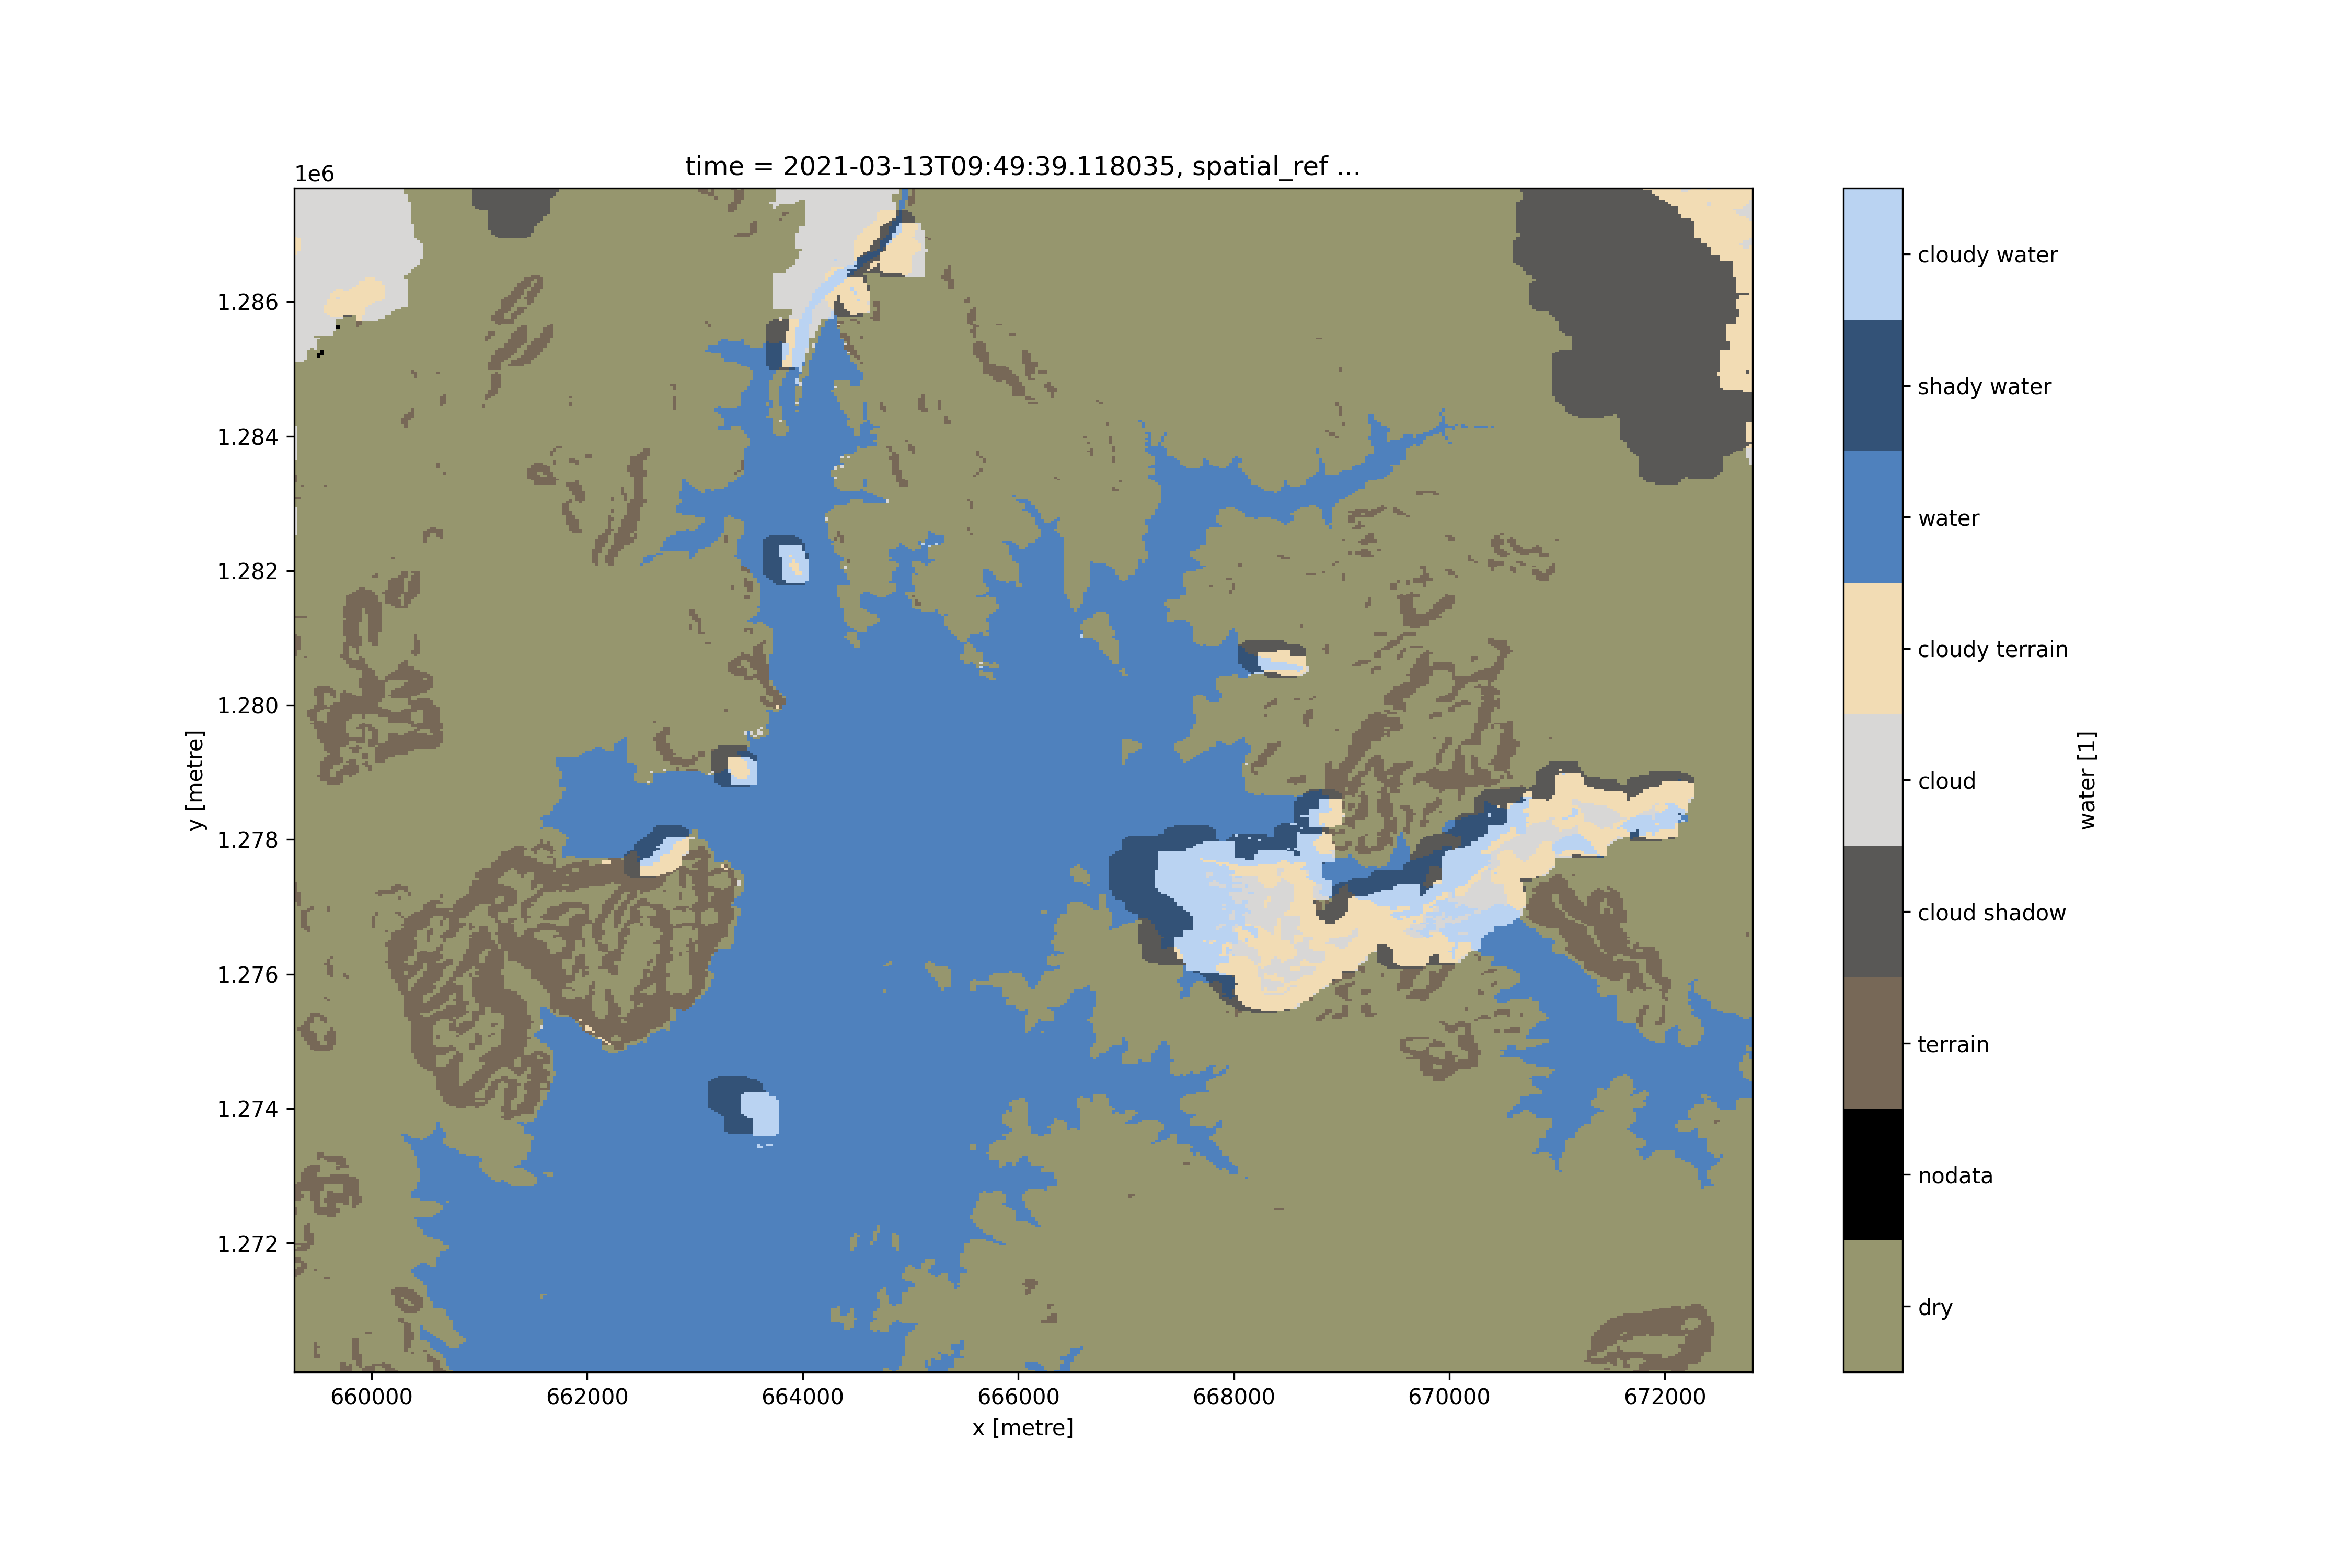
Image 3: Shiroro Reservoir, Nigeria. A WOfS Feature Layer (WOFL) from 13 March 2021.
Colours are assigned by bit flag value. For more detail on WOFL bit flags, see Table 3.
Credit: U.S. Geological Survey Landsat data was used in compiling this image. The plotting schema is attributed to the Digital Earth Australia dea-tools package.
Related services
References
Mueller, N., Lewis, A., Roberts, D., Ring, S., Melrose, R., Sixsmith, J., Lymburner, L., McIntyre, A., Tan, P., Curnow, S., & Ip, A. (2016). Water observations from space: Mapping surface water from 25 years of Landsat imagery across Australia. Remote Sensing of Environment, 174, 341-352. https://doi.org/10.1016/j.rse.2015.11.003
License
CC BY Attribution 4.0 International License
Acknowledgments
The WOfS algorithms incorporated in this product are the work of Norman Mueller, Geoscience Australia, and Dr Dale Roberts, Australian National University.
Data Access
Amazon Web Services S3
The Digital Earth Africa WOfS data can be accessed from the associated S3 bucket.
Table 8: AWS data access details
AWS S3 details |
|
|---|---|
Bucket ARN |
|
Product names |
|
The bucket is located in the region af-south-1 (Cape Town)
The following file path convention applies to WOFLs:
wofs_ls/<version>/<path>/<row>/<year>/<month>/<day>/
Annual Summaries omit path, row, month and day.
wofs_ls_summary_annual/<version>/<year>/
The All-Time Summary additionally drops year.
wofs_ls_summary_alltime/<version>/
Table 9: AWS file path convention
File path element |
Description |
Example |
|---|---|---|
|
|
|
|
Product version |
|
|
Landsat path number ranging from |
|
|
Landsat row number ranging from |
|
|
Year the data was collected |
|
|
Month of the year the data was collected (with leading zeros) |
|
|
Day of the month the data was collected (with leading zeros) |
|
OGC Web Services (OWS)
This product is available through DE Africa’s OWS.
Table 10: OWS data access details.
OWS details |
|
|---|---|
Name |
|
Web Map Services (WMS) URL |
|
Web Coverage Service (WCS) URL |
|
Layer names |
|
Digital Earth Africa OWS details can be found at https://ows.digitalearth.africa/.
For instructions on how to connect to OWS, see this tutorial.
Open Data Cube (ODC)
The WOfS collection can be accessed through the Digital Earth Africa ODC API, which is available through the Digital Earth Africa Sandbox.
ODC product name: wofs_ls, wofs_ls_summary_annual, wofs_ls_summary_alltime
Table 11: WOFL ODC band names
Band name |
Alternative names |
|---|---|
water |
– |
The Annual Summary and the All-Time Summary have the same band names in the ODC.
Table 12: WOfS Annual/All-Time Summary ODC band names
Band name |
Alternative names |
|---|---|
count_wet |
wet |
count_clear |
clear |
frequency |
freq |
For examples on how to use the ODC API, see the DE Africa example notebook repository.
Technical information
Algorithm
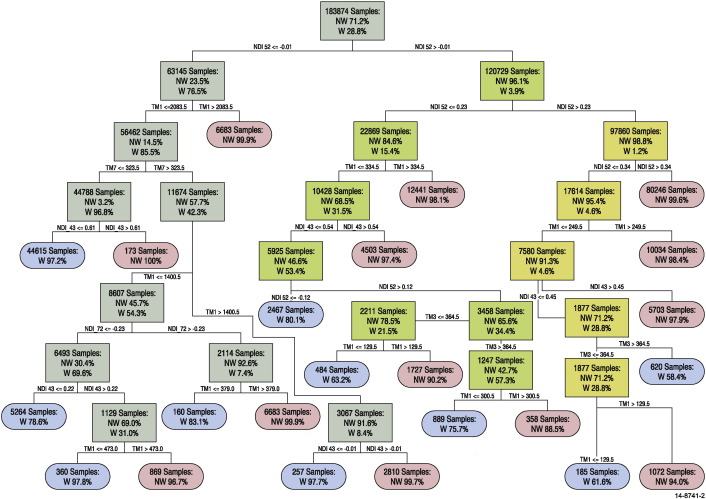
The Water Observations from Space Detection Algorithm uses a decision tree method using both spectral band measurements and derived indices as input datasets. It also utilised several ancillary datasets, including slope.
An illustration of the decision tree is shown in Figure 2.
Figure 2: WOfS Detection Algorithm decision tree. Tree branches are shown in green with endpoint for water and not-water displayed as blue and red respectively. Each branch indicates the variable used to split and the resulting balance of water and not-water samples created by the split. Source: Mueller et al. (2016).
Validation method
The Digital Earth Africa validation task team has many years’ of combined experience validating satellite-derived maps in different regions of Africa, and a long history of collaborating with a wide variety of stakeholders.
To validate WOfS data, the continent was divided into seven Agro-Ecological Zones (AEZ). Analysts from within each regional geospatial organization labelled a large set of sample points using image interpretation of satellite and aerial imagery. Analysts applied their regional and local knowledge to help define class labels and interpret any difficult features, creating a validation dataset that is both accurate and fit for purpose. To ensure WOfS is as accurate as possible, it was validated against a range of data points. 2900 sample points were generated, covering the African continent, including the main islands.
Typically, water classifiers are adept at mapping large, open water bodies - so for this exercise, water features with an area of more than 100 square kilometres were masked out. This ensured that analysis remained focused on areas that are more challenging to map, such as small water bodies with different colours, depths and surrounding environments.
Stratified random sampling was then performed to select locations with different water occurrences and waterbody types. By focusing the sample on the more difficult-to-map areas, this sample scheme allowed the Digital Earth Africa team to understand the limitations of WOfS, and meant that WOfS could be compared to other available datasets. It also resulted in overall accuracy for this exercise appearing lower than expected, since the ‘easy to map’ areas had been removed from the sample design.
Next, analysts labelled each sample point using a visual interpretation of sample points provided by online tool, Collect Earth Online (CEO). CEO allowed multiple analysts to assess points as water or non-water using satellite and aerial images. The labelled sample points were then compared with the WOfS map, determining where the WOfS map service agrees - or disagrees - with the validation dataset.
The sampling design is independent of the WOfS classification, so this validation dataset can be used to provide quantitive comparisons with products such as future versions of WOfS, or other existing surface water maps.
Validation results
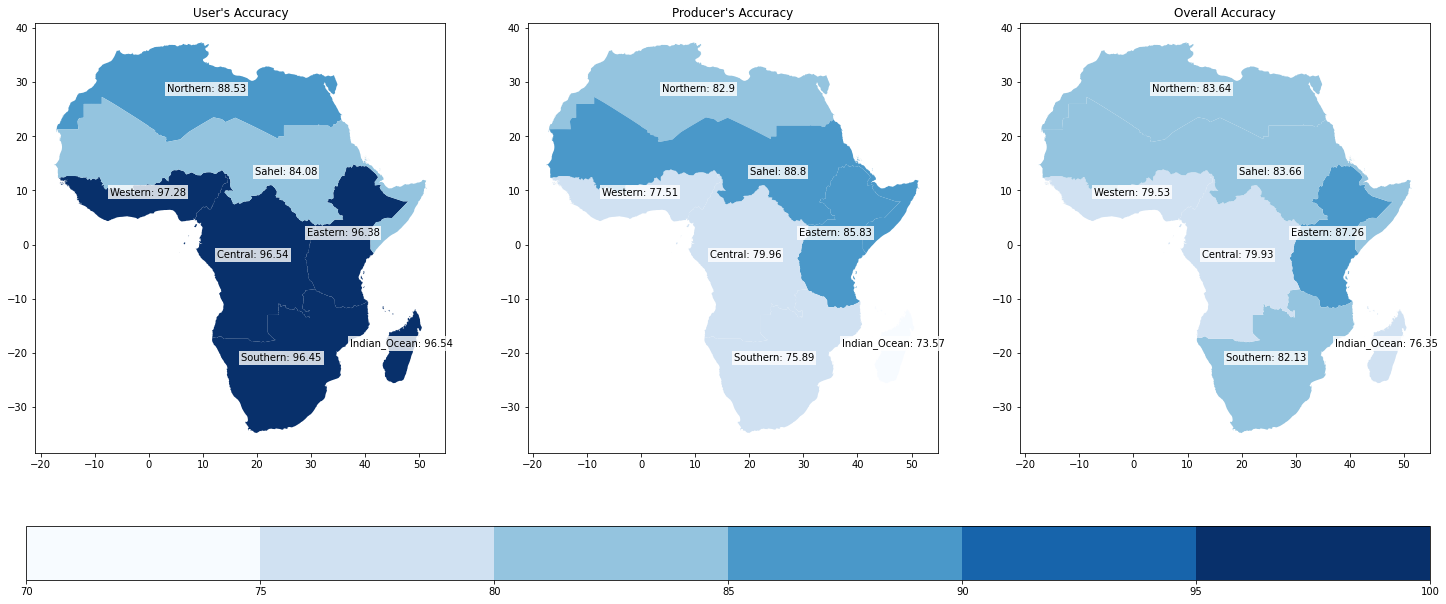
At a continental-scale, WOfS is able to accurately identify about 80% of the labelled water features (Figure 3, right). 94% of its water classifications are correct (Figure 3, left).
At the AEZ level, WOfS performs outstandingly in Eastern, Sahel and Northern AEZs with more than 85% of reference water features in these zones being correctly identified as water (Figure 3, centre). The reliability of this classification in the Eastern zone is also very high at more than 96%; and the WOfS classification in all seven AEZ proved to be reliable, with more than 84% user accuracy (Figure 3, left). The Western AEZ is a challenging zone with high cloud coverage and a wet climate, 77.5% of reference water features have been correctly identified as water in WOfS product, and 97.3% of these water features are actually water.
Figure 3: Overall WOfS accuracy, split by Agro-Ecological Zone.
Limitations on Validation
During the WOfS validation assessment, a number of issues associated with input data, validation method and the WOfS algorithm were recognized. The validation results should be interpreted with the following caveats:
Spatial resolution: The WOfS product is based on 30 m resolution Landsat imagery while the validation data is produced using 10 m resolution Sentinel-2 imagery. WOfS has trouble in areas with mixed pixels (where a pixel covers both water and land). These areas tend to be on edges of lakes and in wetlands where there is a mix of water and vegetation. The Sentinel-2 imagery can identify these edges at a higher resolution than the current Landsat WOfS product.
Temporal resolution: Reference locations may have been observed on different dates by the Sentinel-2 and the Landsat satellites. If the water extent has changed between the dates, a mismatch in the classification is expected.
Interpreting WOfS
The WOfS service should be interpreted with caveats in the following situations:
Mixed pixels: Discretion should be used where a single pixel covers both water and land. These areas tend to occur on the edges of lakes, and in wetlands where there is a mix of water and vegetation.
Turbid or dark water: The WOfS algorithm is developed to identify a diverse range of waterbodies. However, the classifier may miss dark water surfaces or water with high concentration of sediments. In some cases, the impact can be mitigated by using a temporal summary of WOfS, such as the Annual Summary or All-Time Summary. A waterbody may be missed in a single observation, but over the course of the year it is mapped as water in other dates and therefore mapped as a waterbody in the summary products.
Other environmental factors: Sediment, floating vegetation and similar obstructions change the colour of water and can obfuscate water detection by WOfS.
Inaccurate input data: Inaccurate input surface reflectance may lead to false classification in WOfS. To maximize coverage, all pixels within a valid surface reflectance range (0-1) from Landsat Collection 2 are used to generate the WOFLs. When creating WOfS summaries, only WOFLs processed from Landsat Tier 1 data with good geometric accuracy are used.
Note that WOfS is not intended for studying ocean. Validation has been centred around inland and near-coastal waterbodies.