DE Africa Map
This guide provides detailed instructions on how to use the different features of the Digital Earth Africa Map.
Get Started
To launch the DE Africa Map and display some basic data follow these steps.
Launch the DE Africa Map at maps.digitalearth.africa.
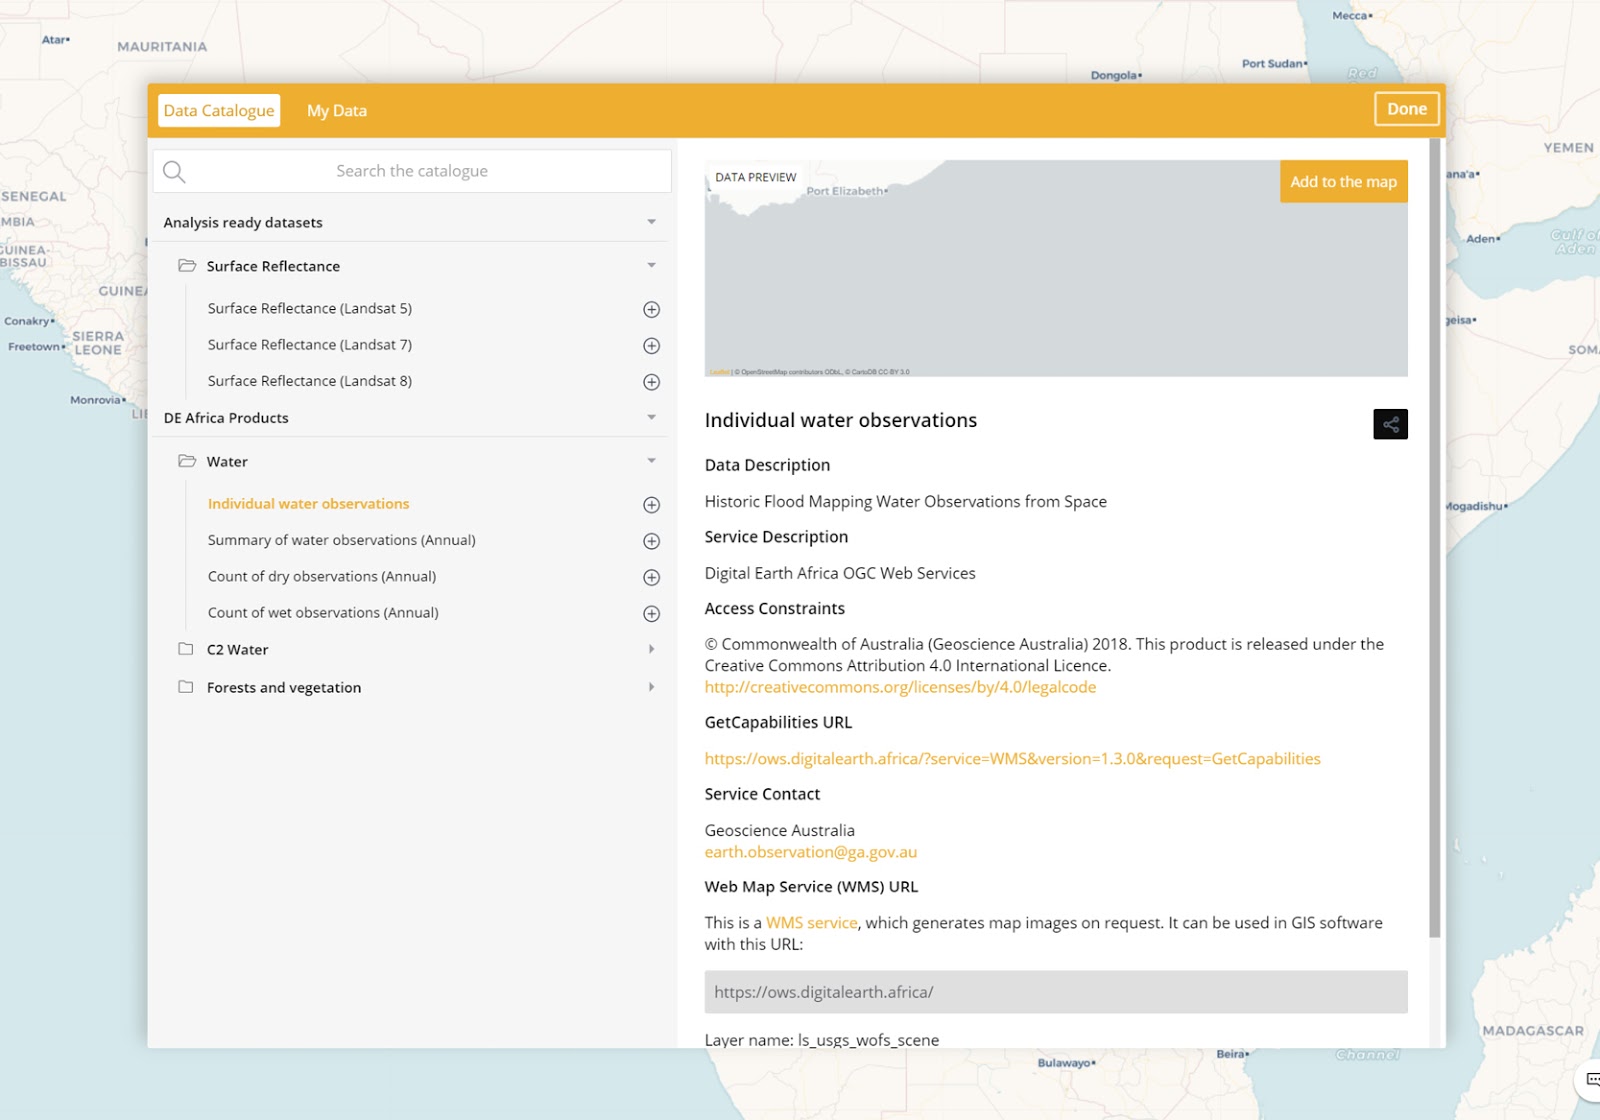
In the left panel click the Add Data button to open the data catalogue (see image below).
Find a dataset of interest such as water.
Select the dataset to see a preview of that data and description.
To view your selected dataset on the map, click the Add to the map button.
Visualise and analyse your dataset:
The spatial data will be displayed in the map view, and a visual legend will appear in the Data workbench, on the left side of the page.
It may not be immediately obvious where your selected spatial data has loaded on the map if it does not cover a large part of Africa. To locate loaded data on the map, go to the workbench, and select Zoom to extent.
The dataset should now be visible in the map view.
To add additional datasets to the map, repeat the above steps.
Zoom manually by moving your mouse pointer over the map and using your mouse wheel to zoom in or out further.
Click and drag the map to further show the region in which you are interested.
Explore the workbench
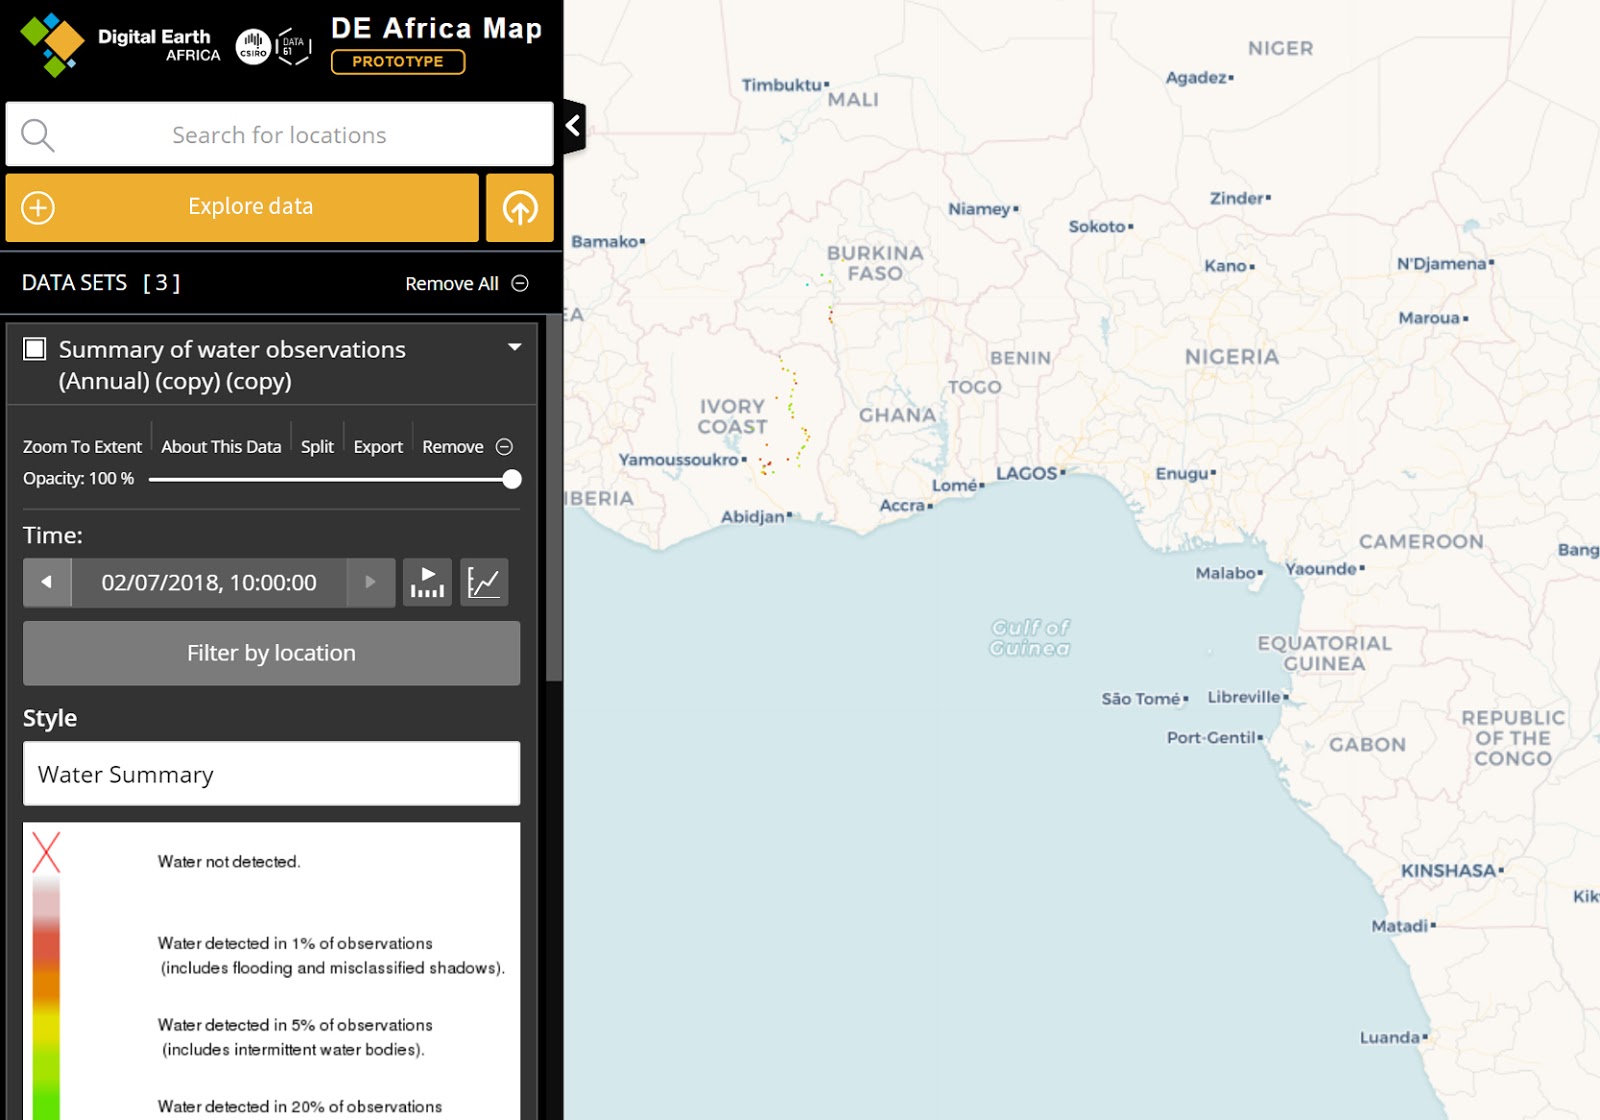
When a dataset is added to the map via the data catalogue, a legend for that dataset will appear in the workbench. From the workbench you can:
Set the order data is shown on the map. To do this, click the title of a dataset and drag it to a new position in your workbench.
Toggle the visibility of added datasets by selecting the checkbox opposite your prefered dataset title
Zoom to the geographical extent of an added data set
Set the opacity of individual data sets
Remove data sets from the map. Note: they can be re-added via the data catalogue.
Navigate the Map
There are multiple ways to navigate DE Africa Map’s map view:
Zooming
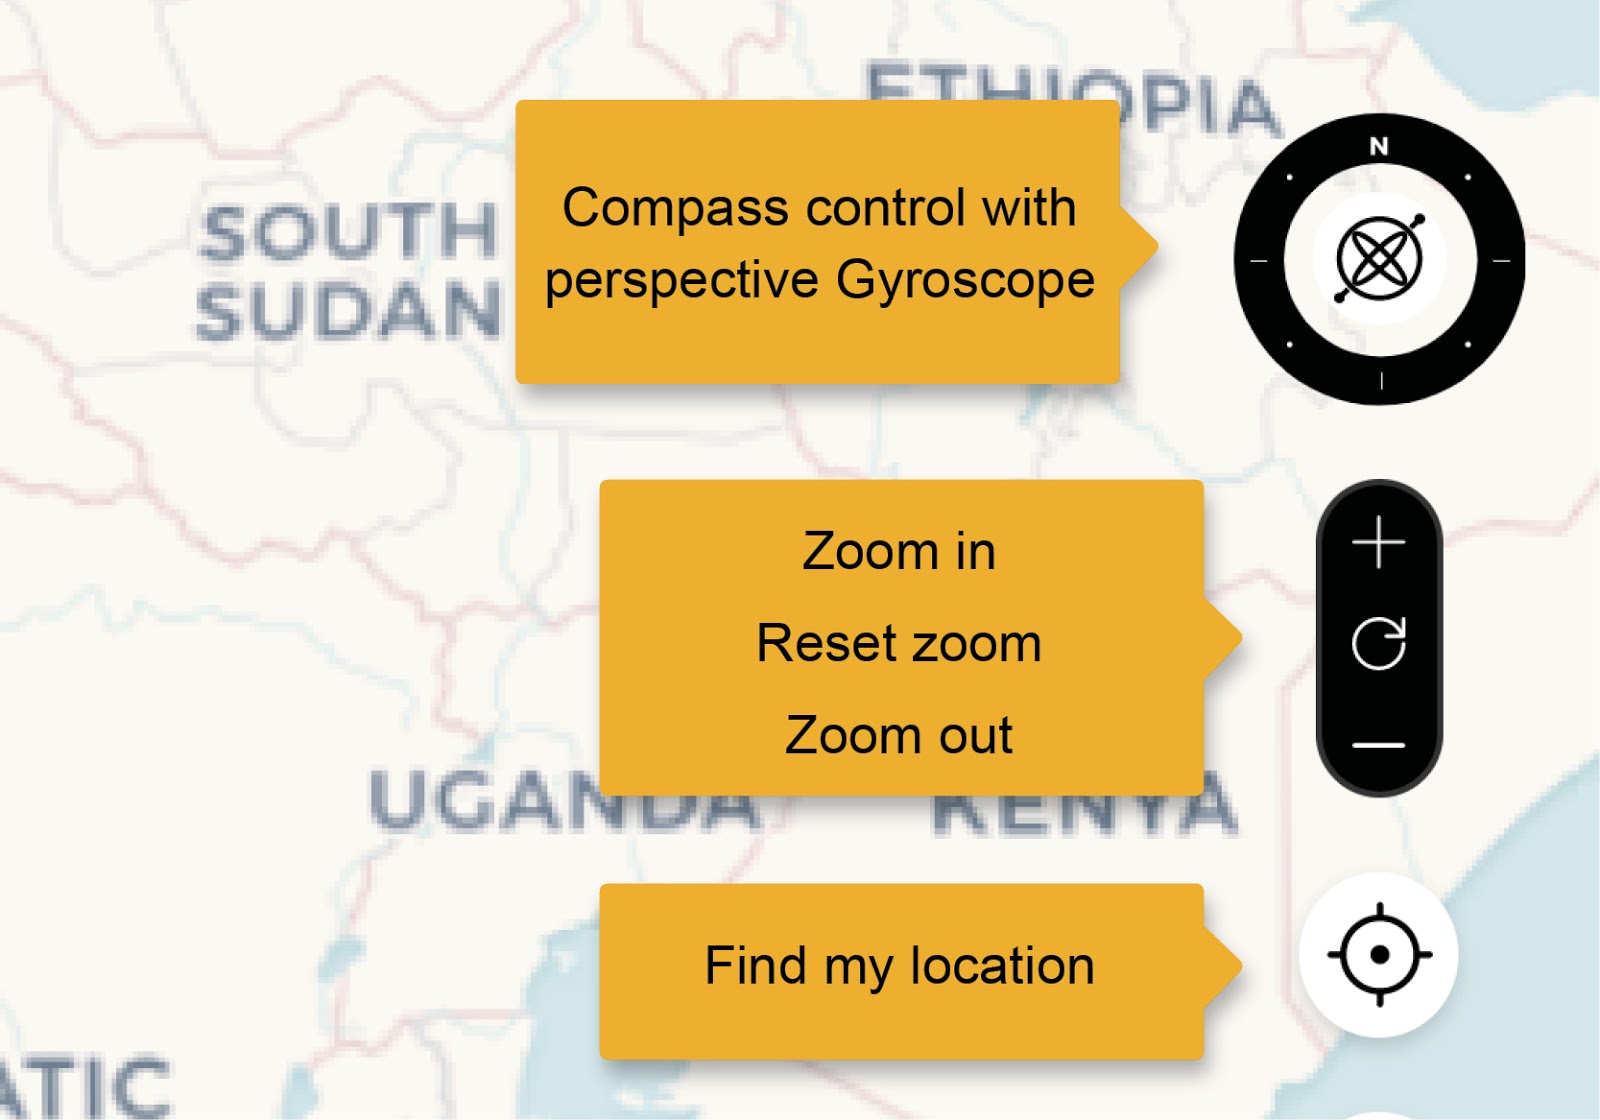
Move your mouse pointer over the map and use the scroll wheel to zoom in or out. The location at the centre of the map display is the centre of the zooming. Right-click and drag upwards or downwards over the map to zoom about the centre point. Select the zoom control to zoom in or out quickly by a set amount.
Panning
Click anywhere on the map and drag it to the required location.
Rotate the map
Use the compass control to rotate the map so North is no longer at the top. Select the “gyroscope” in the centre of the compass control and drag slowly to the left or right to rotate the map clockwise or anti-clockwise respectively. The further you drag, the faster it rotates. Release the mouse button when you reach the desired rotation.
Select the North Point or outer ring of the Compass Control and drag it around to set the desired rotation directly.
Control + left-click and drag left or right over the map to rotate the view about the centre.
Perspective view
Select the “gyroscope” in the centre of the compass control and drag slowly upwards to tilt the view into a perspective view. Drag downwards to tilt the view back to vertical. The further you drag, the faster it tilts. Release the mouse button when you reach the desired view.
Control + left-click and drag upwards or downwards over the map to enter or adjust the perspective view.
When you are in perspective view, control + left-click and drag left or right over the map to “orbit” around the centre of the view. You can also click and drag left or right over the “gyroscope” at the centre of the Compass Control to orbit about the centre of the view.
Double-click the “gyroscope” in the centre of the Compass Control to return the view quickly to a vertical view with North to the top at the current location and scale.
Dragging to pan and using the mouse wheel to zoom still work while showing a perspective view.
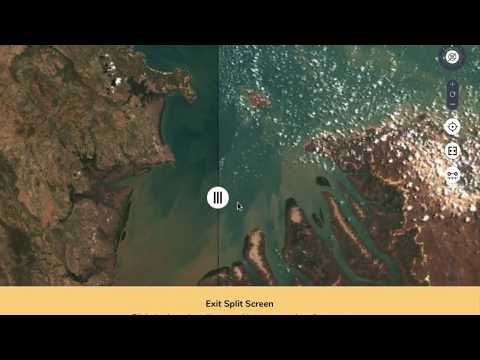
Use the splitter functionality
The splitter functionality allows you to compare a dataset for different time periods. To use it:
Select an area/location
Select a dataset from the catalogue to add it to the workbench
Select the Split link in the workbench to create a copy of the data already selected. Note that you can use the splitter with two different datasets, not just with copies of the same data
Select different times (using the date picker) for the “left” and “right” sections of the screen
Use the back and forward arrows to explore imagery and select cloud-free views
Drag the splitter on the screen to observe the differences
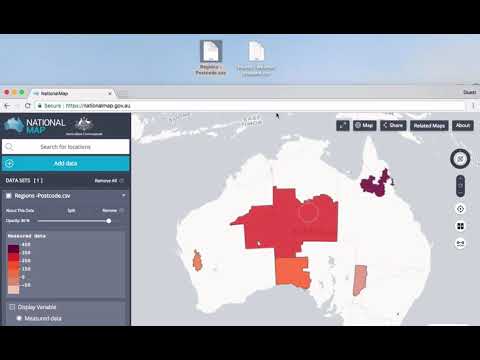
This video shows an example of the splitter used over a map of Australia, but the functionality is the same.
Upload Data to the Map
There are two ways to load your data:
Drag your data file onto the DE Africa Map map view. The format of the data file will be auto-detected.
Select Add Data in the left panel. This will launch the data catalogue. Select the My Data tab at the top of the modal window and follow the provided instructions.
As for DE Africa Map data sets, you can select regions or points to see the data available for that location. If the file is a CSV file, the data from all columns will be shown in the feature information dialogue.
You can also use all of the features of the workbench on the data you have loaded as well.
To share a view of your data with others, you must first publish it to the web somewhere with a URL, and then load it from there.
DE Africa Map can display two kinds of spreadsheets:
Spreadsheets with a point location (latitude and longitude) for each row, expressed as two columns: lat and lon. These will be displayed as points (circles).
Spreadsheets where each row refers to a country using ISO 3166 2-letter or 3-letter code. Columns must be named cnt2, iso2, cnt3 or iso3 according to the CSV-geo-au standard. These will be displayed as regions, highlighting the actual shape of each area.
Spreadsheets must be saved as CSV (comma-separated values).
Other standard spatial data types such as GeoJSON and KML are also supported.