Normalised Difference Vegetation Index (NDVI) Climatology
Date modified: February 2022
Service overview
Description
Digital Earth Africa’s NDVI climatology product represents the long-term average baseline condition of vegetation for every Landsat pixel over the African continent. Both mean and standard deviation NDVI climatologies are available for each calender month.
Some key features of the product are:
NDVI climatologies were developed using harmonized Landsat 5,7,and 8 satellite imagery.
Mean and standard deviation NDVI climatologies are produced for each calender month, using a temporal baseline period from 1984-2020 (inclusive)
Datasets have a spatial resolution of 30 metres
The product contains 36 measurements, across three categories of data (12 measurements within each category, one for each month):
mean_<month>: These measurements show the mean NDVI calculated from all available NDVI data from 1984-2020 for the given month.stddev_<month>: These measurements show the standard deviation of NDVI values of all available NDVI data from 1984-2020 for the given month.count_<month>: These measaurements show the number of clear observations that go into creating the mean and standard deviation measurements.
Important Note: Due to the inconsistent data availability of Landsat 5 over equatorial Africa, and due to persistent cloud coverage over these same regions, the quality of the long-term NDVI baseline is poor in equatorial Africa. We recommend not using the product in locations where the clear obervation count is less than ~30 observations. Below this, the standard deviation layers are prone to data artefacts owing to temporal smoothing operations performing poorly on sparse datasets, and residual cloudy pixels not being sufficiently ‘averaged out’ by a decent volume of input data.
A Jupyter Notebook which demonstrates loading and using this dataset in the Sandbox is also available.
Specifications
Table 1: NDVI Climatology specifications
Specification |
|
|---|---|
Product name |
|
Cell size - X (metres) |
30 |
Cell size - Y (metres) |
30 |
Coordinate reference system |
EPSG: 6933 |
Temporal resolution |
N/A |
Temporal range |
1984-2020 |
Parent dataset |
Landsat 5,7,8 |
Update frequency |
N/A |
Table 2: NDVI Climatology measurements
Band ID |
Description |
Value range |
Data type |
NoData/Fill value |
|---|---|---|---|---|
mean_jan |
Mean NDVI for January (1984-2020) |
|
|
|
mean_feb |
Mean NDVI for February (1984-2020) |
|
|
|
mean_mar |
Mean NDVI for March (1984-2020) |
|
|
|
mean_apr |
Mean NDVI for April (1984-2020) |
|
|
|
mean_may |
Mean NDVI for May (1984-2020) |
|
|
|
mean_jun |
Mean NDVI for June (1984-2020) |
|
|
|
mean_jul |
Mean NDVI for July (1984-2020) |
|
|
|
mean_aug |
Mean NDVI for August (1984-2020) |
|
|
|
mean_sep |
Mean NDVI for September (1984-2020) |
|
|
|
mean_oct |
Mean NDVI for October (1984-2020) |
|
|
|
mean_nov |
Mean NDVI for November (1984-2020) |
|
|
|
mean_dec |
Mean NDVI for December (1984-2020) |
|
|
|
stddev_jan |
Standard Deviation of NDVI for January (1984-2020) |
|
|
|
stddev_feb |
Standard Deviation of NDVI for February (1984-2020) |
|
|
|
stddev_mar |
Standard Deviation of NDVI for March (1984-2020) |
|
|
|
stddev_apr |
Standard Deviation of NDVI for April (1984-2020) |
|
|
|
stddev_may |
Standard Deviation of NDVI for May (1984-2020) |
|
|
|
stddev_jun |
Standard Deviation of NDVI for June (1984-2020) |
|
|
|
stddev_jul |
Standard Deviation of NDVI for July (1984-2020) |
|
|
|
stddev_aug |
Standard Deviation of NDVI for August (1984-2020) |
|
|
|
stddev_sep |
Standard Deviation of NDVI for September (1984-2020) |
|
|
|
stddev_oct |
Standard Deviation of NDVI for October (1984-2020) |
|
|
|
stddev_nov |
Standard Deviation of NDVI for November (1984-2020) |
|
|
|
stddev_dec |
Standard Deviation of NDVI for December (1984-2020) |
|
|
|
count_jan |
Number of clear obs in January (1984-2020) |
|
|
|
count_feb |
Number of clear obs in February (1984-2020) |
|
|
|
count_mar |
Number of clear obs in March (1984-2020) |
|
|
|
count_apr |
Number of clear obs in April (1984-2020) |
|
|
|
count_may |
Number of clear obs in May (1984-2020) |
|
|
|
count_jun |
Number of clear obs in June (1984-2020) |
|
|
|
count_jul |
Number of clear obs in July (1984-2020) |
|
|
|
count_aug |
Number of clear obs in August (1984-2020) |
|
|
|
count_sep |
Number of clear obs in September (1984-2020) |
|
|
|
count_oct |
Number of clear obs in October (1984-2020) |
|
|
|
count_nov |
Number of clear obs in November (1984-2020) |
|
|
|
count_dec |
Number of clear obs in December (1984-2020) |
|
|
|
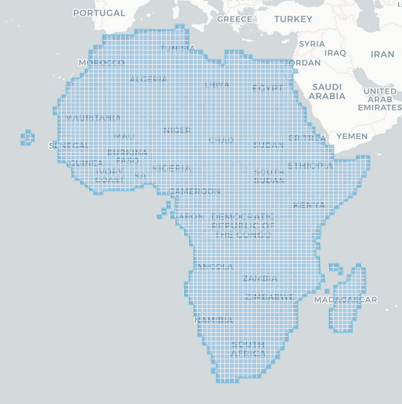
The specific temporal and geographic extents for the product can be explored as an interactive map on the Metadata Explorer. Data is available for the region shaded in blue.
Figure 1: The dataset coverage for the NDVI Climatology product
Media and example images
Image 1: Animations of the NDVI Climatology layers. Left: Mean NDVI; Right: Std. Dev. NDVI
License
CC BY Attribution 4.0 International License
Data Access
Amazon Web Services S3
The NDVI Climatology service is available in AWS S3 thanks to the Public Dataset Program.
Table 3: AWS data access details
AWS S3 details |
|
|---|---|
Bucket ARN |
|
Product name |
|
The bucket is located in the region af-south-1 (Cape Town). Additional region specifications can be applied as follows:
aws s3 ls --region=af-south-1 s3://deafrica-services/ndvi_climatology_ls/
The file paths follow the format:
<productname>/<version>/<x>/<y>/<timeperiod>/<x><y>_<timeperiod>_<band>.<extension>
Table 4: AWS file path convention
File path element |
Description |
Example |
|---|---|---|
|
Product name |
|
|
Product version |
|
|
Tile number in the |
|
|
Tile number in the |
|
|
Year of data collection followed by period of time and time unit in the format |
|
|
File name. Combines |
Open Data Cube (ODC)
The NDVI Climatology datasets can be accessed through the Digital Earth Africa ODC API, which is available through the Digital Earth Africa Sandbox.
ODC product name: ndvi_climatology_ls
For examples on how to use the ODC API, see the DE Africa example notebook repository.
OGC Web Services (OWS)
This service is available through DE Africa’s OWS.
Table 5: OWS data access details.
OWS details |
|
|---|---|
Name |
|
Web Map Services (WMS) URL |
|
Web Coverage Service (WCS) URL |
|
Layer names |
|
Digital Earth Africa OWS details can be found at https://ows.digitalearth.africa/.
For instructions on how to connect to OWS, see this tutorial.
Technical information
Landsat Harmonization method
Landsat satellites have the longest temporal record of Earth Observation data, covering nearly four decades and including landsat 5, 7 and 8 (and now Landsat 9). Ideally, the Landsat data record should be consistent over the Landsat sensor series, but Landsat-8 Operational Land Imager (OLI) has improved calibration over the previous Landsat-7 Enhanced Thematic Mapper (ETM +), and Landsat 5’s ETM. The different qualities of the sensors can result in discontinuities when concatenating NDVI time-series across different sensors.
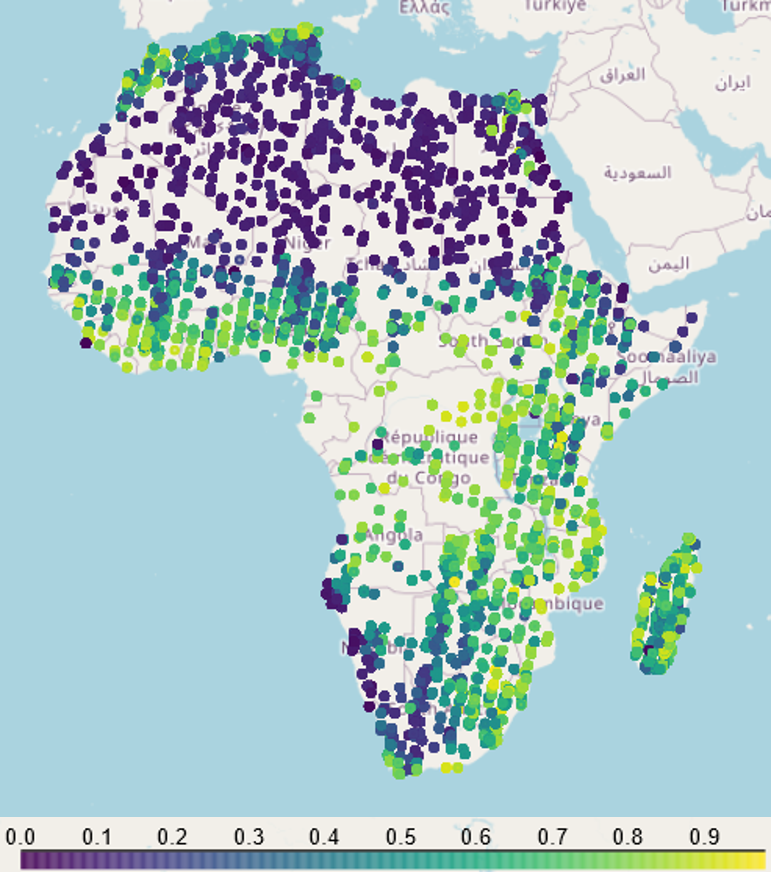
To harmonize the different generations of Landsat sensors, 10,000 60 x 60m polygons were randomly disributed across the continent. At each sample location, a four year time series (2013-2016) of cloud-masked Landsat 7 and Landsat 8 images were loaded, and coincident Landsat 7 and Landsat 8 NDVI observations were retained. Coincident is defined here as acquisitions taken within two days of each other. In total, 35,189 coincident pixel obervations were collected (all pixels within the 60 x 60m polygons were kept).
Figure 1: The locations of coincident Landsat 7 and Landsat 8 images used to define the harmonization coefficients in eq 2. Points are coloured by the NDVI value of the Landsat 8 image.
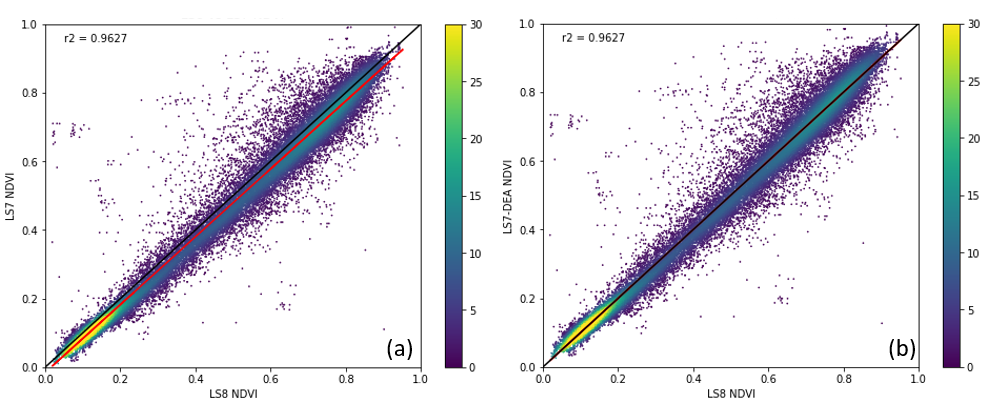
Coincident samples were used to linearly regress Landsat 8 NDVI against Landsat 7 NDVI, the results of this are shown in Figure 2a as a density scatter plot. The linear relationship (eq 1.) between the two is expressed as (also represented by the red line in figure 2a):
eq.1: NDVI_LS7 = 0.988 * NDVI_LS8 -0.015
To harmonize the datasets, Landsat 7 was transformed to better align with Landsat 8 using eq 2. Figure 2b plots the results after harmonization.
eq.2: NDVI_LS7_harmonized = (NDVI_LS7 + 0.015) / 0.988
Figure 2: a) Density scatter plots between Landsat 7 NDVI and Landsat 8 NDVI before harmonization. Red line shows the linear relationship, and the blackline shows the 1:1 line. b) Density scatter plots between Landsat 7 NDVI and Landsat 8 NDVI after harmonization. The red line is directly on top of the 1:1 line
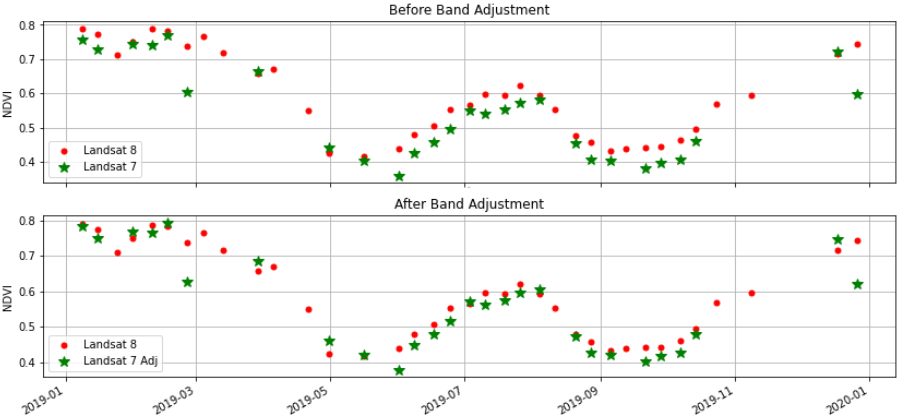
We can visualise how the harmonization improves consistency between the sensors by plotting a time-series of NDVI before and after harmonization (figure 3).
Figure 3: The impact of Landsat 7 harmonization on an NDVI timeseries. Time-series is from an irrigated cropping region in Egypt.
NDVI Climatology Algorithm
The procedure for calculating the NDVI climatologies is listed step-by-step below. The code for reproducing the NDVI climatology product is publicly availabe on github:
Load a concatenated Landsat 5 and Landsat 7 time series
Mask pixels in LS5 and LS7 where:
cloud, and cloud shadows occur, and apply morphological operators opening + dilation (improves the cloud mask)
Surface reflectance values > 65,455 or < 7272.72
Blue band surface reflectance is > 20,910 (removes some cloud missed by Fmask)
Load landsat 8 timeseries
Mask pixels in LS8 where:
cloud, cloud shadows, and cirrus clouds occur, and apply morphological operators opening + dilation (improves the cloud mask)
Surface reflectance values > 65,455 or < 7272.72
Blue band surface reflectance is > 20,910 (removes some cloud missed by fmask)
Calculate NDVI for each sensor
Adjust Landsat 5-7 using
eq. 2.Merge Landsat 5-7 time series with the Landsat 8 time-series
Set as nodata pixels where NDVI is not between 0 and 1
Apply a rolling mean temporal filter (window size = 3) to lesson the influence of noise and missed cloud in the time series
Calculate monthly mean and standard deviation NDVI climatologies.