Cropland Extent (2019)
Date modified: December 2024
Service overview
Background
A central focus for governing bodies in Africa is the need to secure the necessary food sources to support their populations. It has been estimated that the current production of crops will need to double by 2050 to meet future needs for food production. Higher level crop-based products that can assist with managing food insecurity, such as cropping watering intensities, crop types, or crop productivity, require as a starting point precise and accurate cropland extent maps indicating where cropland occurs. Current cropland extent maps are either inaccurate, have coarse spatial resolutions, or are not updated regularly. An accurate, high-resolution, and regularly updated cropland area map for the African continent is therefore recognised as a gap in the current crop monitoring services.
A Jupyter Notebook which demonstrates loading and using cropland extent datasets in the Sandbox is also available.
Description
Digital Earth Africa’s cropland extent map for Africa shows the estimated location of croplands in the following countries for the period January to December 2019:
crop_mask: Entire African continentcrop_mask_eastern: Tanzania, Kenya, Uganda, Ethiopia, Rwanda, and Burundicrop_mask_western: Nigeria, Benin, Togo, Ghana, Cote d’Ivoire, Liberia, Sierra Leone, Guinea, and Guinea-Bissaucrop_mask_northern: Morocco, Algeria, Tunisia, Libya, and Egyptcrop_mask_sahel: Mauritania, Senegal, Gambia, Mali, Burkina Faso, Niger, Chad, Sudan, South Sudan, Somalia, and Djibouticrop_mask_southern: South Africa, Namibia, Botswana, Lesotho, and Eswanticrop_mask_southeast: Zimbabwe, Zambia, Mozambique, and Malawicrop_mask_central: Angola, Democratic Republic of the Congo, Congo, Gabon, Cameroon, Equatorial Guinea, and Central African Republiccrop_mask_indian_ocean: Madagascar, Mauritius, Reunion, and Comoros
Cropland is defined as:
"a piece of land of minimum 0.01 ha (a single 10m x 10m pixel) that is sowed/planted and
harvestable at least once within the 12 months after the sowing/planting date."
This definition will exclude non-planted grazing lands and perennial crops which can be difficult for satellite imagery to differentiate from natural vegetation.
The provisional cropland extent maps have a resolution of 10 metres, and were built using Copernicus Sentinel-2 satellite images from 2019. The cropland extent maps were built seperately using extensive training data from Eastern, Western, Northern, and Sahel Africa, coupled with a Random Forest machine learning model. A detailed exploration of the methods used to produce the cropland extent map can be found in the Jupyter Notebooks in DE Africa’s crop-mask GitHub repository.
Independent validation datasets suggest the following accuracies:
The Eastern Africa crop mask has an overall accuracy of 90.3 %, and an f-score of 0.85
The Western Africa crop mask has an overall accuracy of 83.6 %, and an f-score of 0.75
The Northern Africa crop mask has an overall accuracy of 94.0 %, and an f-score of 0.91
The Sahel Africa crop mask has an overall accuracy of 87.9 %, and an f-score of 0.78
The Southern Africa crop mask has an overall accuracy of 86.4 %, and an f-score of 0.75
The Southeast Africa crop mask has an overall accuracy of 87.3 %, and an f-score of 0.83
The Central Africa crop mask has an overall accuracy of 88.3 %, and an f-score of 0.82
The Indian Ocean Africa crop mask has an overall accuracy of 90.7 %, and an f-score of 0.84
The algorithms for most regions tend to report more omission errors (labelling actual crops as non-crops) than commission errors (labelling non-crops as crops). Where commission errors occur, they tend to be focussed around wetlands and seasonal grasslands which spectrally resemble some kinds of cropping.
The products contain three measurements:
mask: This band displays cropped regions as a binary map. Values of1indicate the presence of crops, while a value of0indicates the absence of cropping. This band is a pixel-based cropland extent map, meaning the map displays the raw output of the pixel-based Random Forest classification.prob: This band displays the prediction probabilities for the ‘crop’ class. As this service uses a random forest classifier, the prediction probabilities refer to the percentage of trees that voted for the random forest classification. For example, if the model had 200 decision trees in the random forest, and 150 of the trees voted ‘crop’, the prediction probability is 150 / 200 x 100 = 75 %. Thresholding this band at > 50 % will produce a map identical tomask.filtered: This band displays cropped regions as a binary map. Values of1indicate the presence of crops, while a value of0indicates the absence of cropping. This band is an object-based cropland extent map where themaskband has been filtered using an image segmentation algorithm (see this paper for details on the algorithm used). During this process, segments smaller than 1 Ha (100 10m x 10m pixels) are merged with neighbouring segments, resulting in a map where the smallest classified region is 1 Ha in size. Thefiltereddataset is provided as a complement to themaskband; small commission errors are removed by object-based filtering, and the ‘salt and pepper’ effect typical of classifying pixels is diminished.
Specifications
Table 1: Cropland extent specifications
Specification |
|
|---|---|
Product names |
|
Cell size - X (metres) |
10 |
Cell size - Y (metres) |
10 |
Coordinate reference system |
EPSG: 6933 |
Temporal resolution |
Annual |
Temporal range |
2019 |
Parent dataset |
Sentinel-2 Semiannual GeoMAD |
Update frequency |
TBD |
Table 2: Cropland extent measurements
Band ID |
Description |
Value range |
Data type |
NoData/Fill value |
|---|---|---|---|---|
mask |
crop extent (pixel) |
|
|
|
prob |
crop probability (pixel) |
|
|
|
filtered |
crop extent (object-based) |
|
|
|
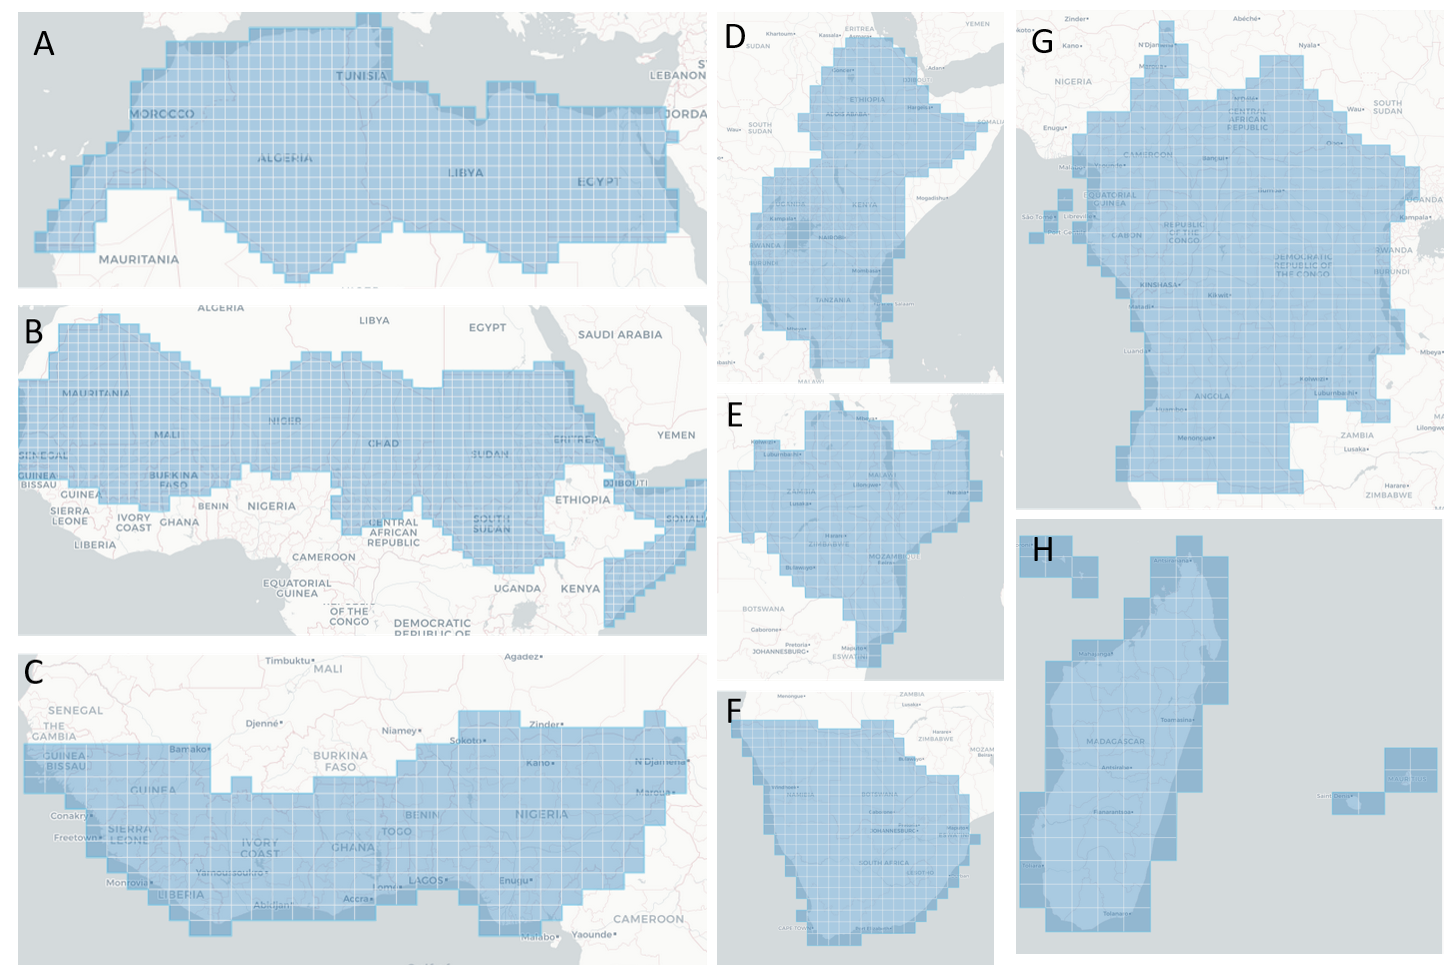
Figure 1: The dataset coverage for the provisional cropland extent maps; a) Northern Africa, b) Sahel Africa, c) Western Africa, d) Eastern Africa, e) Southeast Africa, f) Southern Africa, g) Central Africa, h) Indian Ocean
Media and example images
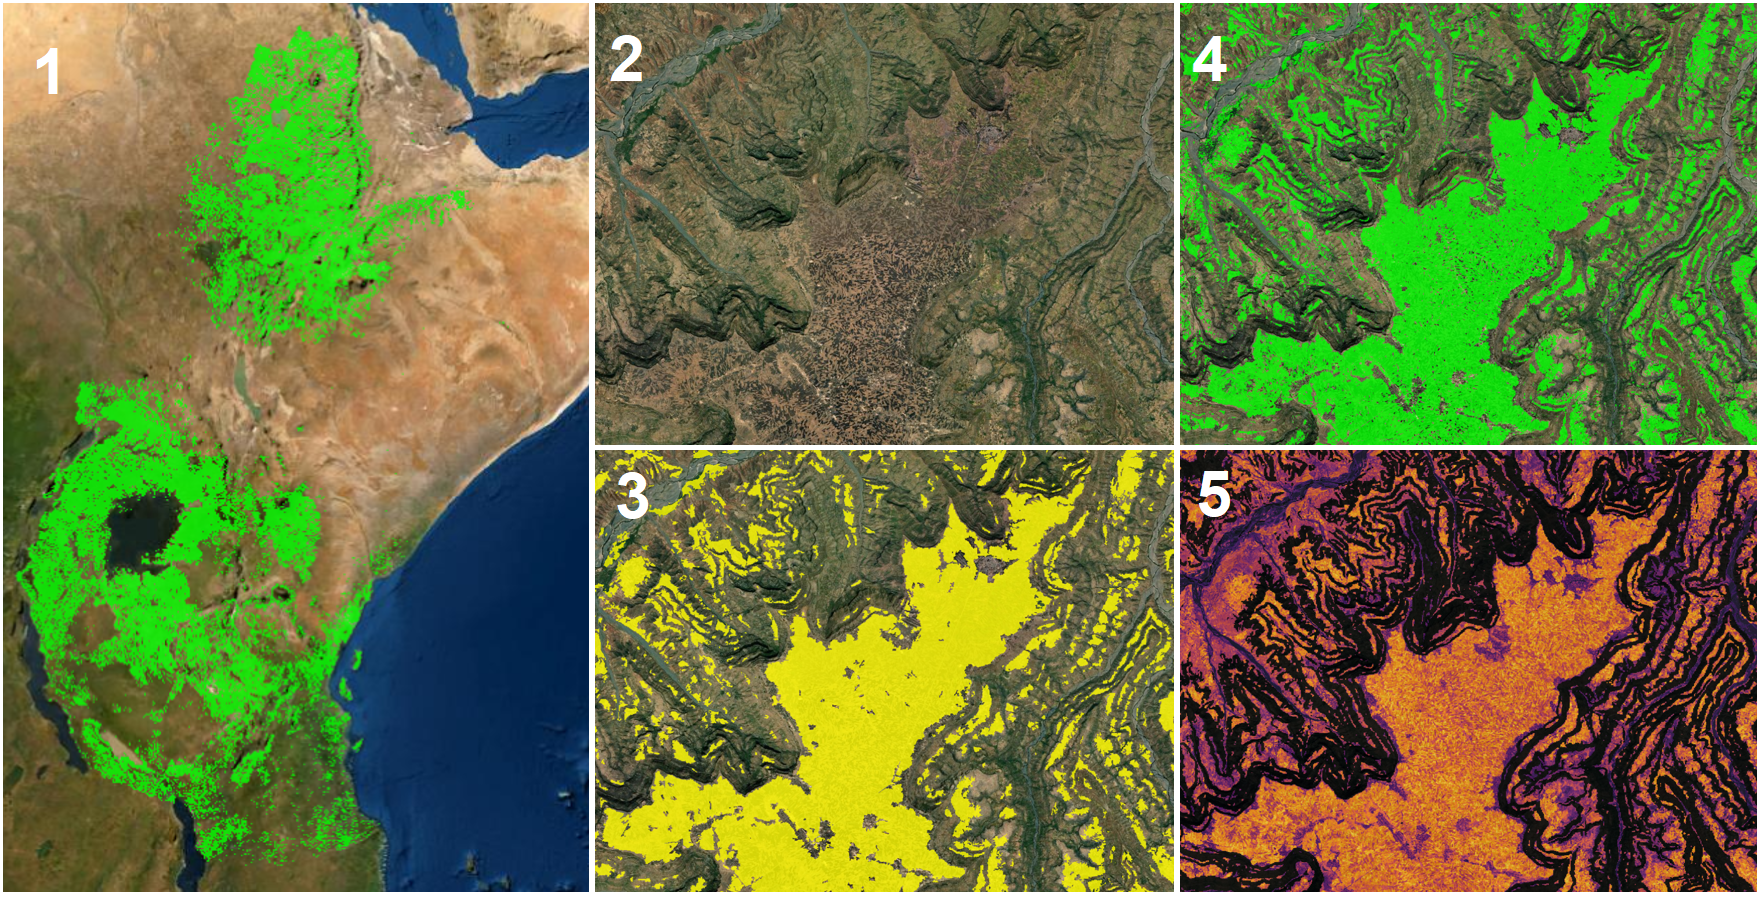
Image 1: Example of Eastern Africa cropland extent near Addis Ababa, Ethiopia.
1.1: Cropland extent (pixel) for the entire East Africa region
1.2: True colour image
1.3: Cropland extent (object-filtered)
1.4: Cropland extent (pixel)
1.5: Crop probability; purple-to-pink regions show low probability, orange-yellow regions show high probability
License
CC BY Attribution 4.0 International License
Data Access
Amazon Web Services S3
The cropland extent service is available in AWS S3 thanks to the Public Dataset Program.
AWS S3 details |
|
|---|---|
Bucket ARN |
|
Product names |
|
The bucket is located in the region af-south-1 (Cape Town)
The following file path convention applies to the crop mask:
s3://deafrica-services/crop_mask/1-0-0/<path>/<row>/<year>/
s3://deafrica-services/crop_mask_eastern/1-0-0/<path>/<row>/<year>/
s3://deafrica-services/crop_mask_western/1-0-0/<path>/<row>/<year>/
s3://deafrica-services/crop_mask_northern/1-0-0/<path>/<row>/<year>/
s3://deafrica-services/crop_mask_sahel/1-0-0/<path>/<row>/<year>/
s3://deafrica-services/crop_mask_southern/1-0-0/<path>/<row>/<year>/
s3://deafrica-services/crop_mask_southeast/1-0-0/<path>/<row>/<year>/
s3://deafrica-services/crop_mask_central/1-0-0/<path>/<row>/<year>/
s3://deafrica-services/crop_mask_indian_ocean/1-0-0/<path>/<row>/<year>/
Open Data Cube (ODC)
The cropland extent datasets can be accessed through the Digital Earth Africa ODC API, which is available through the Digital Earth Africa Sandbox.
ODC product names: crop_mask, crop_mask_eastern, crop_mask_western, crop_mask_northern, crop_mask_sahel, crop_mask_southern, crop_mask_southeast, crop_mask_central, crop_mask_indian_ocean
For examples on how to use the ODC API, see the DE Africa example notebook repository.
OGC Web Services (OWS)
This service is available through DE Africa’s OWS.
Table 3: OWS data access details.
OWS details |
|
|---|---|
Name |
|
Web Map Services (WMS) URL |
|
Web Coverage Service (WCS) URL |
|
Layer names |
|
Digital Earth Africa OWS details can be found at https://ows.digitalearth.africa/.
For instructions on how to connect to OWS, see this tutorial.
Technical information
Algorithm
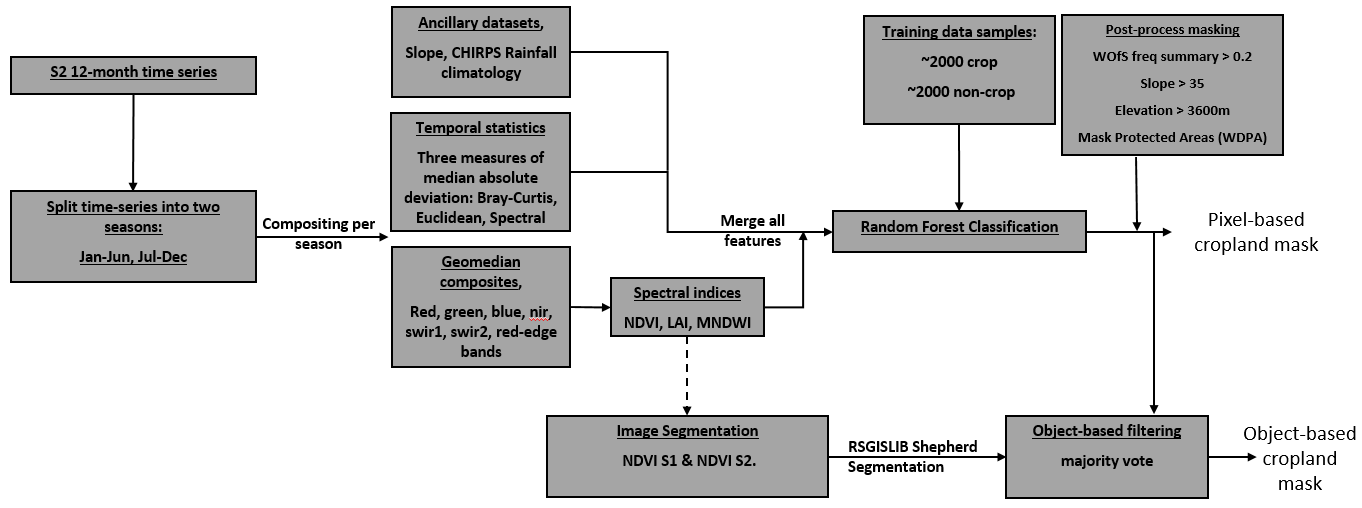
Figure 2: The algorithm used to generate the cropland extent map for each region of Africa.
Training and Validation data
Reference data for the continental cropland extent map will be officially released when the remainder of the cropland extent maps are produced. For now, the training and validation data can be downloaded directly from github:
Training data:
Eastern cropland extent training data is located here
Western cropland extent training data is here.
Northern cropland extent training data is here.
Sahel cropland extent training data is here.
Southern cropland extent training data is here.
Southeast cropland extent training data is here.
Central cropland extent training data is here.
Indian Ocean cropland extent training data is here
Validation data:
Validation data for Eastern Africa is located here as a shapefile and is called
validation_samples.shp.Validation data for Western Africa is located here as a shapefile and is called
validation_samples.shp.Validation data for Northern Africa is located here as a shapefile and is called
validation_samples.shp.Validation data for Sahel Africa is located here as a shapefile and is called
validation_samples.shp.Validation data for Southern Africa is located here as a shapefile and is called
validation_samples.shp.Validation data for Southeast Africa is located here as a shapefile and is called
validation_samples.shp.Validation data for Central Africa is located here as a shapefile and is called
validation_samples.shp.Validation data for Indian Ocean Africa is located here as a shapefile and is called
validation_samples.shp.
Validation method
Reference samples, used to both create and validate the cropland extent maps, were produced as part of the broader continental-scale cropland extent for Africa project lead by the Digital Earth Africa Establishment team. Polygons were labelled through the DE Africa distributed network of implementing partners as part of the DE Africa Validation Task Team. These partners include RCMRD, OSS, AfriGIST, AGRHYMET, NADMO, and DE Africa.
The reference dataset was created using a stratified sampling design. Samples were stratified at two levels. First, samples were stratified by simplified Agro-Ecological Zones (AEZs). Second, within each AEZ, samples were stratified by a pre-existing, high-quality cropland extent map, namely the Global Food Security-Support Analysis Data (GFSAD) at 30m product. The GFSAD product was reprojected to 60 x 60m cells using ‘mode’ as the aggregating statistic. This increased the probability of samples falling within homogenous crop/non-crop regions. For each AEZ, 2,000 40 x 40 metre polygons were randomly generated, with polygons equally split between the crop and non-crop labels of the reprojected GFSAD product.
Sample polygons for each AEZ were assessed using Collect Earth Online (CEO) tool developed by NASA SERVIR. Analysts used image interpretation to classify each polygon as either ‘crop’, ‘non-crop’, ‘mixed’, or ‘unsure’; where the ‘crop’ and ‘non-crop’ labels was only selected if the sample region is homogeneously crop or non-crop. Monthly Sentinel-2 mosaics, a two year NDVI time-series (2018-06 to 2020-06), and Bing ‘Aerial’ basemaps were available to assist the image interpretation.
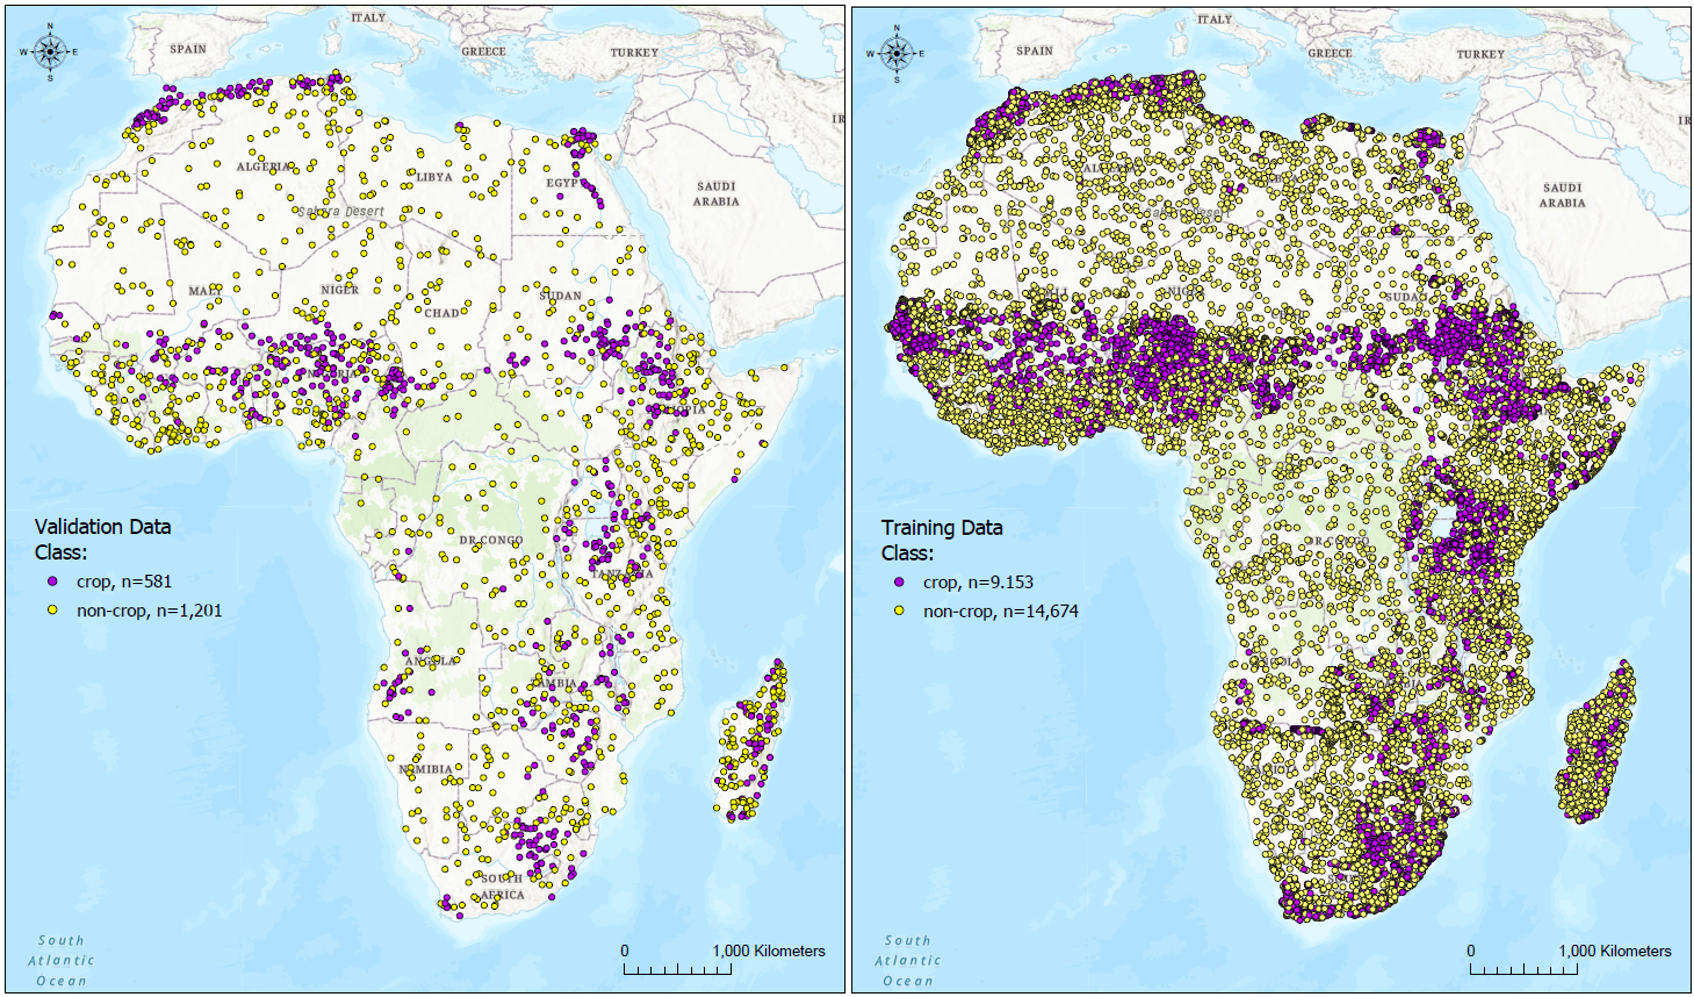
In total, around >25,000 training samples, and ~1,800 validation samples were collected as shown in Figure 3 below.
Figure 3: Reference locations for the cropland extent maps.
Left: Locations of the map validation samples, Right: Locations of the training samples
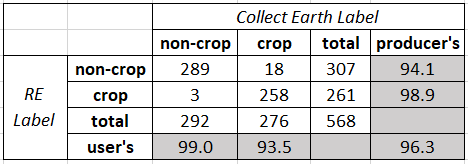
The accuracy of the method for collecting reference samples described above was independently evaluated by Radiant Earth. Radiant Earth’s team developed a visualisation app to validate a random subset of the labels collected using the CEO tool. The app retrieves Airbus SPOT imagery over the area of interest in four 6-month windows (covering the two-year of the training data specification). For each AEZ, the app would sequentially retrieve the images for each individual polygon, visualize all the available imagery and overlay the polygon on top of it. A member of Radiant’s team would then interpret the class (Crop, No-Crop, Mixed) based on the guideline and examples provided by Digital Earth Africa, and record that in the app. After validating all polygons, a new GeoJSON file would be generated with the additional property for validation labels. The results of this independent validation of DE Africa’s reference samples are shown in Table 4. The overall accuracy is 96.3 %, indicating that the reference samples are of a high quality and fit-for-purpose.
Table 4: Validation of the reference data samples
Validation results
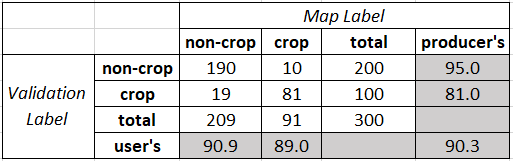
The cropland extent map for Eastern Africa was validated using an isolated set of 300 samples (100 crop, 200 non-crop). The results are shown as a confusion matrix in Table 5. The overall accuracy is 90.3%. The producer’s accuracy for the crop class is 81 % (omission error of 19 %), and the user’s accuracy is 89 % (commission error of 11 %).
Table 5: Validation results for the Eastern Africa cropland extent map
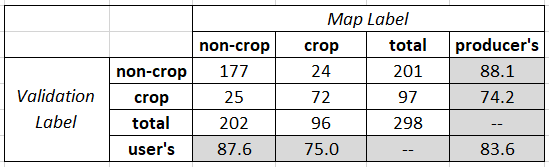
The cropland extent map for Western Africa was validated using an isolated set of 298 samples (97 crop, 201 non-crop). The results are shown as a confusion matrix in Table 6. The overall accuracy is 83.6 %. The producer’s accuracy for the crop class is 74.2 % (omission error of 25.8 %), and the user’s accuracy is 75.0 % (commission error of 25.0 %).
Table 6: Validation results for the Western Africa cropland extent map
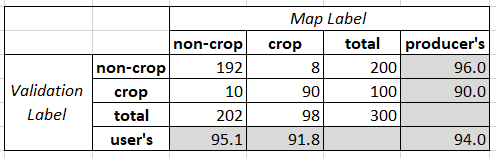
The cropland extent map for Northern Africa was validated using an isolated set of 300 samples (100 crop, 200 non-crop). The results are shown as a confusion matrix in Table 7. The overall accuracy is 94.0 %. The producer’s accuracy for the crop class is 90.0 % (omission error of 10.0 %), and the user’s accuracy is 91.8 % (commission error of 8.2 %).
Table 7: Validation results for the Northern Africa cropland extent map
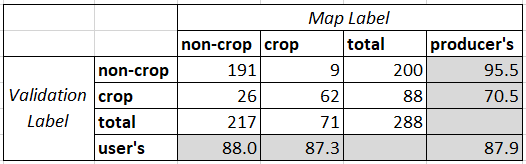
The cropland extent map for Sahel Africa was validated using an isolated set of 288 samples (88 crop, 200 non-crop). The results are shown as a confusion matrix in Table 8. The overall accuracy is 87.9 %. The producer’s accuracy for the crop class is 70.5 % (omission error of 29.5 %), and the user’s accuracy is 87.3 % (commission error of 12.7 %).
Table 8: Validation results for the Sahel Africa cropland extent map
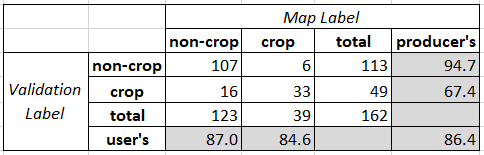
The cropland extent map for Southern Africa was validated using an isolated set of 166 samples (49 crop, 113 non-crop). The results are shown as a confusion matrix in Table 9. The overall accuracy is 86.4 %. The producer’s accuracy for the crop class is 67.4 % (omission error of 32.6 %), and the user’s accuracy is 84.6 % (commission error of 15.4 %).
Table 9: Validation results for the Southern Africa cropland extent map
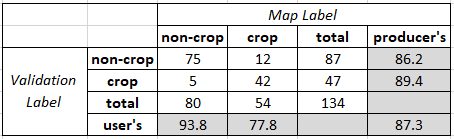
The cropland extent map for Southeast Africa was validated using an isolated set of 134 samples (47 crop, 87 non-crop). The results are shown as a confusion matrix in Table 10. The overall accuracy is 87.3 %. The producer’s accuracy for the crop class is 89.4 % (omission error of 10.6 %), and the user’s accuracy is 77.8 % (commission error of 22.2 %).
Table 10: Validation results for the Southeast Africa cropland extent map
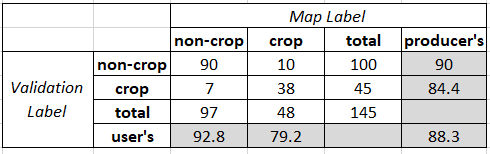
The cropland extent map for Central Africa was validated using an isolated set of 145 samples (45 crop, 100 non-crop). The results are shown as a confusion matrix in Table 11. The overall accuracy is 88.3 %. The producer’s accuracy for the crop class is 84.4 % (omission error of 15.6 %), and the user’s accuracy is 79.2 % (commission error of 20.8 %).
Table 11: Validation results for the Central Africa cropland extent map
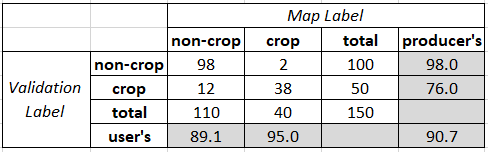
The cropland extent map for Indian Ocean Africa was validated using an isolated set of 150 samples (50 crop, 100 non-crop). The results are shown as a confusion matrix in Table 12. The overall accuracy is 90.7 %. The producer’s accuracy for the crop class is 76.0 % (omission error of 24.0 %), and the user’s accuracy is 95.0 % (commission error of 5.0 %).
Table 12: Validation results for the Indian Ocean Africa cropland extent map