World Settlement Footprint
Date modified: 21 November 2023
Product Overview
Background
According to the UN Department of Economics and Social Affairs, 9.7 billion people will inhabit the planet by the year 2050. 55% of the world’s population presently resides in urban areas, and by 2050, that number is projected to increase to 68%. Rapid and haphazard urbanization, when paired with the problems posed by climate change, can increase air pollution, make people more susceptible to catastrophes, and cause problems with the management of resources like water, raw materials, and energy (Mapping Our Human Footprint From Space, 2023).
To improve the understanding of current trends in global urbanisation, ESA and the German Aerospace Center (DLR), in collaboration with the Google Earth Engine team, are jointly developing the World Settlement Footprint – the world’s most comprehensive dataset on human settlement (G.D. Team, 2023).
The World Settlement Footprint 2015 is a 10m (0.32 arc sec) resolution binary mask outlining the 2015 global settlement extent derived by jointly exploiting multitemporal Sentinel-1 radar and Landsat-8 optical satellite imagery (Marconcini et al., 2020).
The World Settlement Footprint 2019 features data from the Copernicus Sentinel-1 and Sentinel-2 missions and provides information on global human settlements with unprecedented detail and precision (Marconcini et al., 2021).
The World Settlement Footprint Evolution was produced by processing seven million images from the US Landsat satellite collected between 1985 and 2015 and shows the annual growth of human settlements globally (Mapping Our Human Footprint From Space, 2023).
The World Settlement Footprint 2015, 2019, World Settlement Footprint Evolution data are now indexed in the DE Africa platform.
Product User Manual
A Jupyter Notebook for the World Settlement Footprint 2015 and 2019 dataset and Jupyter Notebook for the World Settlement Footprint Evolution which demonstrates loading and using the datasets in the Sandbox is also available.
Specifications
Spatial and temporal coverage
The specific temporal and geographic extents for the product can be explored as an interactive map on the metadata for 2015, 2019 and Evolution.
Table 1: World Settlement Footprint product specifications
Specification |
|||
|---|---|---|---|
Product name |
|
|
|
Cell size - X |
10m |
10m |
30m |
Cell size - Y |
10m |
10m |
30m |
Coordinate reference system |
|
|
|
Temporal resolution |
NA |
NA |
NA |
Temporal range |
2015 |
2019 |
1985 - 2015 |
Update frequency |
NA |
NA |
NA |
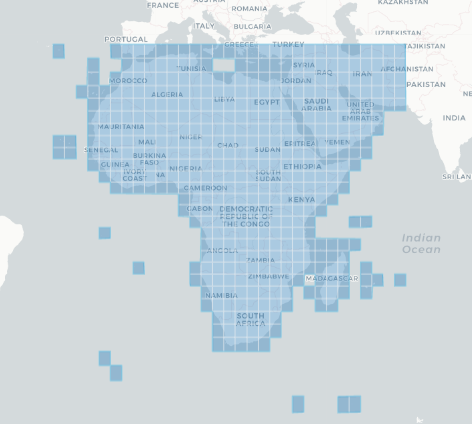
Data is available for the region shaded in blue.
Figure 1: World Settlement Footprint product geographic extent
Measurements
Table 2: World Settlement Footprint product measurements
Band ID |
Description |
Units |
Data type |
No data\(^\dagger\) |
|---|---|---|---|---|
wsf_2015 |
World Settlement Footprint 2015 |
1 |
uint8 |
0.0 |
wsf_2019 |
World Settlement Footprint 2019 |
1 |
uint8 |
0.0 |
wsfevolution |
World Settlement Footprint Evolution |
1 |
uint8 |
0.0 |
idcscore |
Input Data Consistency score |
1 |
uint8 |
0.0 |
Processing
The World Settlement Footprint WSF 2015 version 2 (WSF2015 v2) is a 10m resolution binary mask outlining the extent of human settlements globally for the year 2015. Specifically, the WSF2015 v2 is a pilot product generated by combining multiple datasets.The World Settlement Footprint (WSF) 2015 derived at 10m spatial resolution by means of 2014-2015 multitemporal Landsat-8 and Sentinel-1 imagery (of which ~217K and ~107K scenes have been processed, respectively). The High Resolution Settlement Layer (HRSL) generated by the Connectivity Lab team at Facebook through the employment of 2016 DigitalGlobe VHR satellite imagery and publicly released at 30m spatial resolution for 214 countries (Marconcini et al., 2020).
The World Settlement Footprint (WSF) 2019 is a 10m resolution binary mask outlining the extent of human settlements globally derived by means of 2019 multitemporal Sentinel-1 (S1) and Sentinel-2 (S2) imagery. Based on the hypothesis that settlements generally show a more stable behavior with respect to most land-cover classes, temporal statistics are calculated for both S1- and S2-based indices. In particular, a comprehensive analysis has been performed by exploiting a number of reference building outlines to identify the most suitable set of temporal features (ultimately including 6 from S1 and 25 from S2). Training points for the settlement and non-settlement class are then generated by thresholding specific features, which varies depending on the 30 climate types of the well-established Köppen Geiger scheme. Next, binary classification based on Random Forest is applied and, finally, a dedicated post-processing is performed where ancillary datasets are employed to further reduce omission and commission errors. Here, the whole classification process has been entirely carried out within the Google Earth Engine platform. To assess the high accuracy and reliability of the WSF2019, two independent crowd-sourcing-based validation exercises have been carried out with the support of Google and Mapswipe, respectively, where overall 1M reference labels have been collected based photointerpretation of very high-resolution optical imagery (Marconcini et al., 2021).
The World Settlement Footprint (WSF Evolution) is a 30m resolution dataset outlining the global settlement extent on a yearly basis from 1985 to 2015. Based on the assumption that settlement growth occurred over time, all pixels categorized as non-settlement in the WSF2015 (Marconcini et al., 2020) are excluded a priori from the analysis. Next, for each target year in the past, all available Landsat-5/7 scenes acquired over the given area of interest are gathered and key temporal statistics (i.e., temporal mean, minimum, maximum, etc.) are then extracted for different spectral indices. Among others, these include: the normalized difference built-up index (NDBI), normalized difference vegetation index (NDVI) and modified normalized difference water index (MNDWI). Temporal features proved generally robust if computed over at least 7 clear cloud-/cloud-shadow-free observations; accordingly, if for a given pixel in the target year this constraint is not satisfied, the time frame is enlarged backwards (at 1-year steps) as long as the condition is met.
Starting backwards from the year 2015 - for which the WSF2015 is used as a reference - settlement and non-settlement training samples for the given target year t are iteratively extracted by applying morphological filtering to the settlement mask derived for the year t+1, as well as excluding potentially mislabeled samples by adaptively thresholding the temporal mean NDBI, MNDWI and NDVI. Finally, binary Random Forest classification in performed.
To quantitatively assess the high accuracy and reliability of the dataset, an extensive campaign based on crowdsourcing photointerpretation of very high-resolution airborne and satellite historical imagery has been performed with the support of Google. In particular, for the years 1990, 1995, 2000, 2005, 2010 and 2015, ~200K reference cells of 30x30m size distributed over 100 sites around the world have been labelled, hence summing up to overall ~1.2M validation samples.
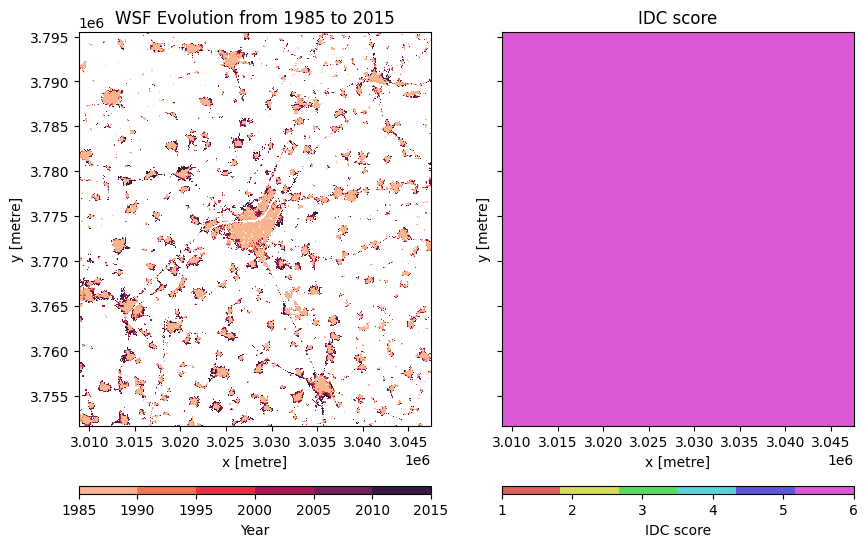
It is worth noting that past Landsat-5/7 availability considerably varies across the world and over time. Independently from the implemented approach, this might then result in a lower quality of the final product where few/no scenes have been collected. Accordingly, to provide the users with a suitable and intuitive measure that accounts for the goodness of the Landsat imagery, we conceived the Input Data Consistency (IDC) score, which ranges from 6 to 1 with: 6) very good; 5) good; 4) fair; 3) moderate; 2) low; 1) very low. The IDC score is available on a yearly basis between 1985 and 2015 and supports a proper interpretation of the WSF evolution product.
The WSF evolution and IDC score datasets are organized in 5138 GeoTIFF files (EPSG4326 projection) each one referring to a portion of 2 x 2 degree size (~222 x 222 km) on the ground. WSF evolution values range between 1985 and 2015 corresponding to the estimated year of settlement detection, whereas 0 is no data. A comprehensive publication with all technical details and accuracy figures is currently being finalized. For the time being, please refer to Marconcini et al,. 2021.
Media and example images
Figure 2: World Settlement Footprint over Kumasi, Ghana
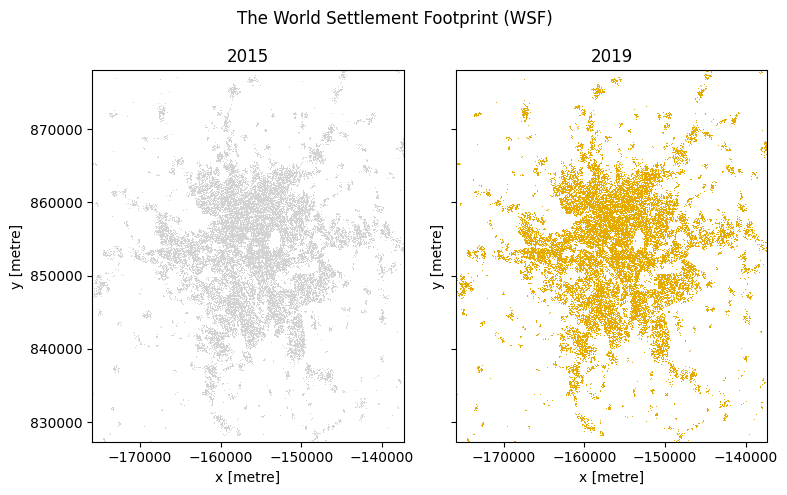
Figure 3: World Settlement Footprint over Harare, Zimbabwe
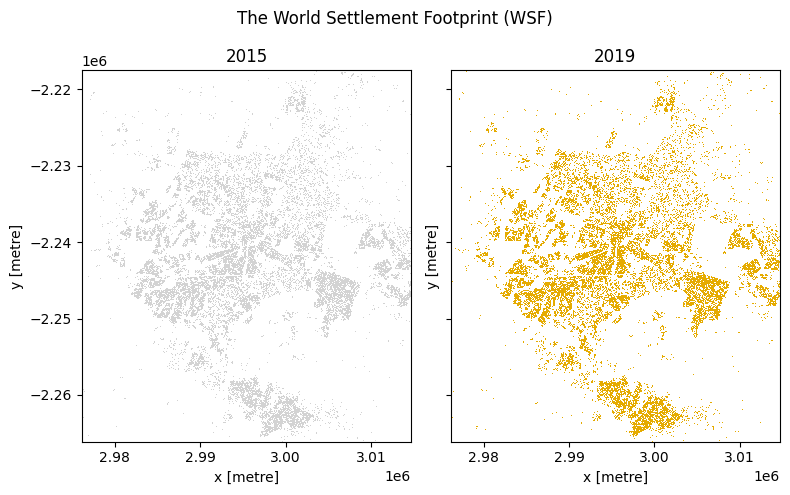
Figure 4: World Settlement Footprint Evolution over Mansoura, Egypt with IDC score for the image
References
Mapping our human footprint from space(Accessed on 2023 August). ESA - Mapping Our Human Footprint From Space. https://www.esa.int/Applications/Observing_the_Earth/Mapping_our_human_footprint_from_space
Marconcini, M., Metz-Marconcini, A., Üreyen, S. et al. Outlining where humans live, the World Settlement Footprint 2015. Sci Data 7, 242 (2020). https://doi.org/10.1038/s41597-020-00580-5
Mattia Marconcini, Annekatrin Metz-Marconcini, Thomas Esch and Noel Gorelick. Understanding Current Trends in Global Urbanisation - The World Settlement Footprint Suite. GI_Forum 2021, Issue 1, 33-38 (2021) https://austriaca.at/0xc1aa5576%200x003c9b4c.pdf
G.D.Team (Accessed on 2023 August). EOC Geoservice Map Contexts. EOC Geoservice Map Contexts. https://geoservice.dlr.de/web/maps
License and Acknowledgements
The World Settlement Footprint is provided free of charge, without restriction of use. For the full license information see the Creative Commons Attribution 4.0 International License.
Data Acess
Amazon Web Service
The World Settlement Footprint 10m 2015 2019, Evolution products are avaliable in AWS S3.
Table 3: AWS data acess details.
AWS S3 details |
|
|---|---|
Bucket ARD |
|
Bucket |
|
The products are hosted on the wsf_{year} S3 bucket in the AWS deafrica-input-datasets.
The file paths follow the format: s3://deafrica-input-datasets/wsf_{year}/
OGC Web Services (OWS)
The World Settlement Footprint 10m product wsf_2015, wsf_2019, wsf_evolution are available through the Digital Earth Africa’s OWS.
Table 4: OWS data access details.
OWS details |
|
|---|---|
Name |
|
Web Map Services (WMS) URL |
|
Web Coverage Service (WCS) URL |
|
Layer name |
|
Digital Earth Africa OWS details can be found at https://ows.digitalearth.africa/.
For instructions on how to connect to OWS, see this tutorial.
Open Data Cube (ODC)
The World Settlement Footprint product can be accessed through the Digital Earth Africa ODC API, which is available through the Digital Earth Africa Sandbox.
ODC product name: wsf_{year} and wsf_evolution
The wsf_{year} product has only one specific band of data which can be called by using the default name, wsf{year}, as listed in the table below. ODC Datacube.load commands without specified bands will load the wsf_{year} band.
Table 5: ODC product World Settlement Footprint band names.
Band name |
Alternative names |
Fill value |
|---|---|---|
wsf{year} |
NaN |
|
wsfevolution |
NaN |
|