Forecasting surface water extent in the Okavango delta
Using the results from our modelled discharge, upstream rainfall, and vector auto regression
Load packages
Import Python packages that are used for the analysis.
[1]:
from statsmodels.tsa.vector_ar.var_model import VAR
from statsmodels.tsa.stattools import adfuller
from statsmodels.tools.eval_measures import rmse
from statsmodels.tsa.stattools import grangercausalitytests
import numpy as np
import pandas as pd
import matplotlib.pyplot as plt
Analysis parameters
[2]:
freq = 'Q-DEC'
data = 'results/okavango_all_datasets.csv'
modelled_discharge = 'results/modelled_discharge_Q-DEC.csv'
Read in data
[3]:
we=pd.read_csv(data, index_col='time', parse_dates=True)[['water_extent', 'okavango_rain']]
df=pd.read_csv(modelled_discharge, index_col=0, parse_dates=True)
df=df.join(we).drop(['water_discharge'],axis=1).dropna()
df.head(2)
[3]:
| upstream_rainfall | predicted_discharge | water_extent | okavango_rain | |
|---|---|---|---|---|
| 2013-12-31 | 100.739380 | 11902.015733 | 52.2846 | 61.88324 |
| 2014-03-31 | 120.626221 | 27059.141065 | 163.8918 | 157.48248 |
Test causation
The basis behind Vector AutoRegression is that each of the time series in the system influences each other. That is, you can predict the series with past values of itself along with other series in the system. Below, we conduct a Granger’s Causality Test to see if the variables are related to each other. In the table that’s printed after running the two cells belows shows a given p-value is < significance level (0.05), then, the corresponding X series (column) causes the Y (row).
[4]:
# def grangers_causation_matrix(data, variables, maxlag=3, test='ssr_chi2test', verbose=False):
#     """Check Granger Causality of all possible combinations of the Time series.
#     The rows are the response variable, columns are predictors. The values in the table
#     are the P-Values. P-Values lesser than the significance level (0.05), implies
#     the Null Hypothesis that the coefficients of the corresponding past values is
#     zero, that is, the X does not cause Y can be rejected.

#     data      : pandas dataframe containing the time series variables
#     variables : list containing names of the time series variables.
#     """
#     df = pd.DataFrame(np.zeros((len(variables), len(variables))), columns=variables, index=variables)
#     for c in df.columns:
#         for r in df.index:
#             test_result = grangercausalitytests(data[[r, c]], maxlag=maxlag, verbose=False)
#             p_values = [round(test_result[i+1][0][test][1],4) for i in range(maxlag)]
#             if verbose: print(f'Y = {r}, X = {c}, P Values = {p_values}')
#             min_p_value = np.min(p_values)
#             df.loc[r, c] = min_p_value
#     df.columns = [var + '_x' for var in variables]
#     df.index = [var + '_y' for var in variables]
#     return df

# grangers_causation_matrix(df, variables = df.columns)
Conduct iterative back-test to validate forecasting ability
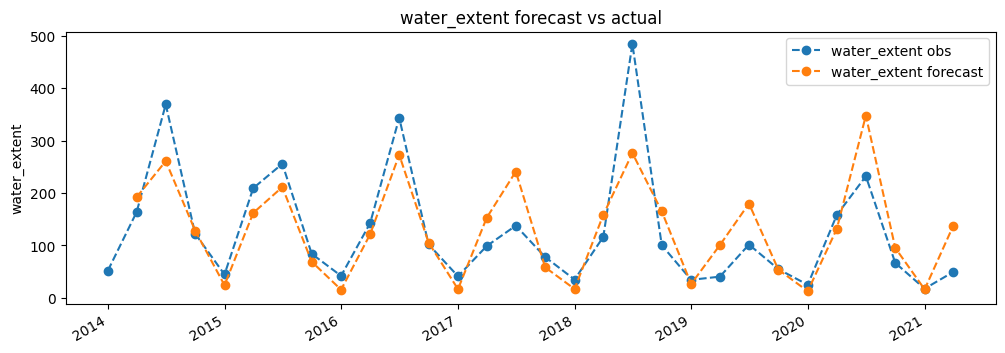
Here we will conduct a forecast, but over an interval of the time-series that we already have observations for. This will allow us to test the model’s forecasting ability
First, lets initiate a model
[5]:
model=VAR(df, freq=freq)
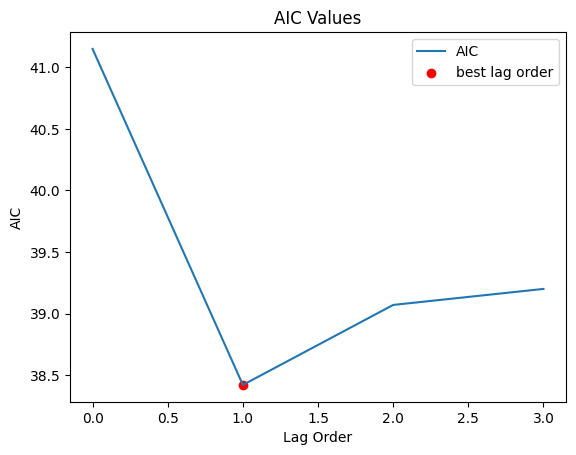
Find the best lag order using Akaike information criterion (AIC)
[6]:
#calculate AIC
x=model.select_order(maxlags=3)
aic=pd.read_html(x.summary().as_html(),header=0, index_col=0)[0][['AIC']]
aic['AIC']=[float(i[0:5]) for i in aic.values.flatten()]
lag_order = aic.idxmin().values[0]

#plot
aic.plot()
plt.scatter(lag_order, aic.loc[lag_order], color='r', label='best lag order')
plt.title('AIC Values')
plt.ylabel('AIC')
plt.xlabel('Lag Order')
plt.legend()
print("Lag order to use is "+str(lag_order))
Lag order to use is 1

Create and fit a model on the data
Using the lag order defined above
[7]:
model=VAR(df, freq=freq)
model_fit = model.fit(1)
[8]:
forecast_length = lag_order
[9]:
n_windows = int((len(df) / forecast_length) - 1)
window_size = forecast_length

aa = window_size
dfs=[]
for i in range(0, n_windows):
    start=aa+lag_order
    end=(aa)
    backtest_input = df.values[-start:-end]
    fc = model_fit.forecast(y=backtest_input, steps=window_size)
    if i == 0:
        index=df.index[-end:]
    else:
        index=df.index[-end:-(end-window_size)]
    fc = pd.DataFrame(fc, index=index, columns=df.columns)
    dfs.append(fc)
    aa+=window_size

#concat results together
fc=pd.concat(dfs)
fc.columns = fc.columns.get_level_values(0)
[10]:
test=df[df.index.isin(fc.index)]
for i in test.columns:
    print('rmse value for', i, 'is : ', round(rmse(fc[[i]], test[[i]])[0],2))
rmse value for upstream_rainfall is :  48.79
rmse value for predicted_discharge is :  15682.77
rmse value for water_extent is :  183.53
rmse value for okavango_rain is :  44.29
[11]:
col = 'water_extent'
plt.figure(figsize=(12,4))
plt.plot(df.index, df[col], label=col+' obs',linestyle='dashed', marker='o')
fc[col].plot(label=col+' forecast',linestyle='dashed', marker='o')
plt.ylabel(col)
plt.title(col+" forecast vs actual")
plt.legend();

Forecasting Water Extent
[12]:
#make final predictions
model = VAR(endog=df, freq=freq)
model_fit = model.fit(lag_order)

pred = model_fit.forecast(df.values[-model_fit.k_ar:], steps=forecast_length)
[13]:
#converting predictions to dataframe
cols = df.columns
fc = pd.DataFrame(index=range(0,len(pred)), columns=[cols])
for j in range(0,len(cols)):
    for i in range(0, len(pred)):
        fc.iloc[i][j] = pred[i][j]

fc.index = pd.date_range(freq=freq, start=df.index[-1], periods=len(fc)+1)[1:]
fc.head()
[13]:
| upstream_rainfall | predicted_discharge | water_extent | okavango_rain | |
|---|---|---|---|---|
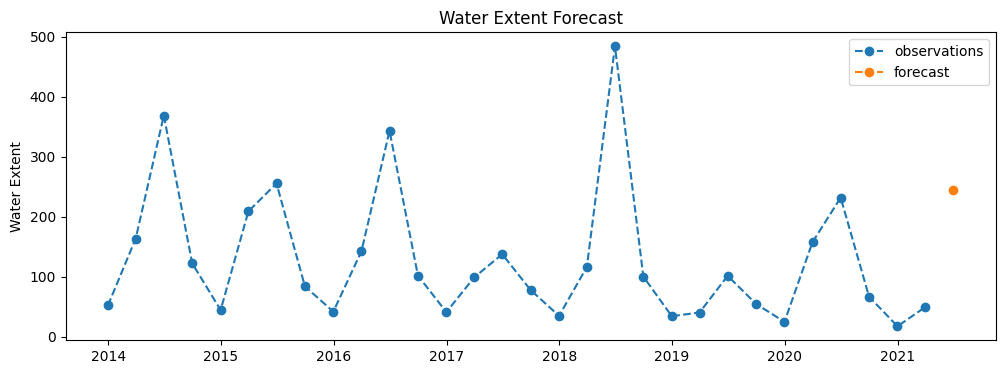
| 2021-06-30 | -12.659938 | 34071.346128 | 244.632889 | -7.007658 |
[14]:
plt.figure(figsize=(12,4))
plt.plot(df.index, df['water_extent'], label='observations',linestyle='dashed', marker='o')
plt.plot(fc.index, fc[['water_extent']], label='forecast',linestyle='dashed', marker='o')
plt.ylabel('Water Extent')
plt.title("Water Extent Forecast")
# plt.ylim(0.0,0.9)
plt.legend();

Additional information
License: The code in this notebook is licensed under the Apache License, Version 2.0. Digital Earth Africa data is licensed under the Creative Commons by Attribution 4.0 license.
Contact: If you need assistance, please post a question on the Open Data Cube Slack channel or on the GIS Stack Exchange using the open-data-cube tag (you can view previously asked questions here). If you would like to report an issue with this notebook, you can file one on
Github.
Last Tested:
[15]:
from datetime import datetime
datetime.today().strftime('%Y-%m-%d')
[15]:
'2023-08-21'