Extracting historical climate (rainfall) data over selected basins
Products used: ERA5
Getting started
To run this analysis, run all the cells in the notebook, starting with the “Load packages” cell.
Load packages
Import Python packages that are used for the analysis.
[1]:
%matplotlib inline

# Force GeoPandas to use Shapely instead of PyGEOS
# In a future release, GeoPandas will switch to using Shapely by default.
import os
os.environ['USE_PYGEOS'] = '0'

import datacube
import matplotlib.pyplot as plt
import numpy as np
import pandas as pd
import geopandas as gpd

from deafrica_tools.spatial import xr_rasterize
from deafrica_tools.load_era5 import load_era5
from deafrica_tools.dask import create_local_dask_cluster
Analysis Parameters
[2]:
# Original shapefile from https://data.apps.fao.org/map/catalog/srv/api/records/57bb1c95-2f00-4def-886f
vector_file = 'data/OB_FWR_Hydrography_Okavango_Subasins_polygon.geojson'

# define time period of interest
time_range = '2013-12', '2021-05-31'
Define areas of interest in the Okavango Basin
[3]:
# load basin polygons
# Original shapefile from https://data.apps.fao.org/map/catalog/srv/api/records/57bb1c95-2f00-4def-886f-caee3d756da9
basin = gpd.read_file(vector_file)

# upstream include Cuito and Cubango subbasins
upstream = basin[basin.Subbasin.isin(['Cuito', 'Cubango'])]

# delta is part of the Okavango subbasin
delta = basin[basin.Subbasin.isin(['Okavango'])]

print(upstream)
   CLASS_ID  Longitude   Latitude Subbasin      Sph_Area      Sph_Len  Parts  \
0         0  19.003252 -15.179938    Cuito  5.902293e+10  2285720.103    1.0
1         0  17.870032 -15.740153  Cubango  1.078813e+11  3071839.684    1.0

   Vertices                                           geometry
0    9326.0  POLYGON ((17.85205 -13.53846, 17.85205 -13.536...
1   11314.0  POLYGON ((15.99370 -13.93323, 15.99370 -13.931...
Retrieve historical rainfall data over all areas of interest
[4]:
# get historical rainfall for upstream and delta
bounds = pd.concat([upstream, delta]).total_bounds
lat = bounds[1], bounds[3]
lon = bounds[0], bounds[2]
[5]:
# download ERA5 rainfall and aggregate to monthly
var = 'total_precipitation_24hr'
precip_1W = load_era5(var, lat, lon, time_range, reduce_func=np.sum, resample='1W').compute()

#resample to 3 month seasons
precip = precip_1W.resample(time='3M').sum()

# fix inconsistency in axis names
precip = precip.rename({'lat':'latitude', 'lon':'longitude'})
precip_1W = precip_1W.rename({'lat':'latitude', 'lon':'longitude'})
Create area mask for upstream and okavango regions
[6]:
upstream_raster = xr_rasterize(upstream, precip)
delta_raster = xr_rasterize(delta, precip)
Calculate the total rainfall over each area
[7]:
upstream_rainfall = precip[var].where(upstream_raster).sum(['latitude','longitude'])
okavango_rainfall = precip[var].where(delta_raster).sum(['latitude','longitude'])

upstream_rainfall_1W = precip_1W[var].where(upstream_raster).sum(['latitude','longitude'])
[8]:
upstream_rainfall_1W = precip_1W[var].where(upstream_raster).sum(['latitude','longitude'])
Export results as csv
[9]:
upstream_rainfall.to_dataframe().drop('spatial_ref',axis=1).rename({'total_precipitation_24hr':'cumulative 3-month rainfall (mm)'},axis=1).to_csv(f'results/upstream_rainfall_{time_range[0]}_to_{time_range[1]}.csv')
okavango_rainfall.to_dataframe().drop('spatial_ref',axis=1).rename({'total_precipitation_24hr':'cumulative 3-month rainfall (mm)'},axis=1).to_csv(f'results/okavango_rainfall_{time_range[0]}_to_{time_range[1]}.csv')

upstream_rainfall_1W.to_dataframe().drop('spatial_ref',axis=1).rename({'total_precipitation_24hr':'cumulative 1-week rainfall (mm)'},axis=1).to_csv(f'results/upstream_rainfall_1W_{time_range[0]}_to_{time_range[1]}.csv')
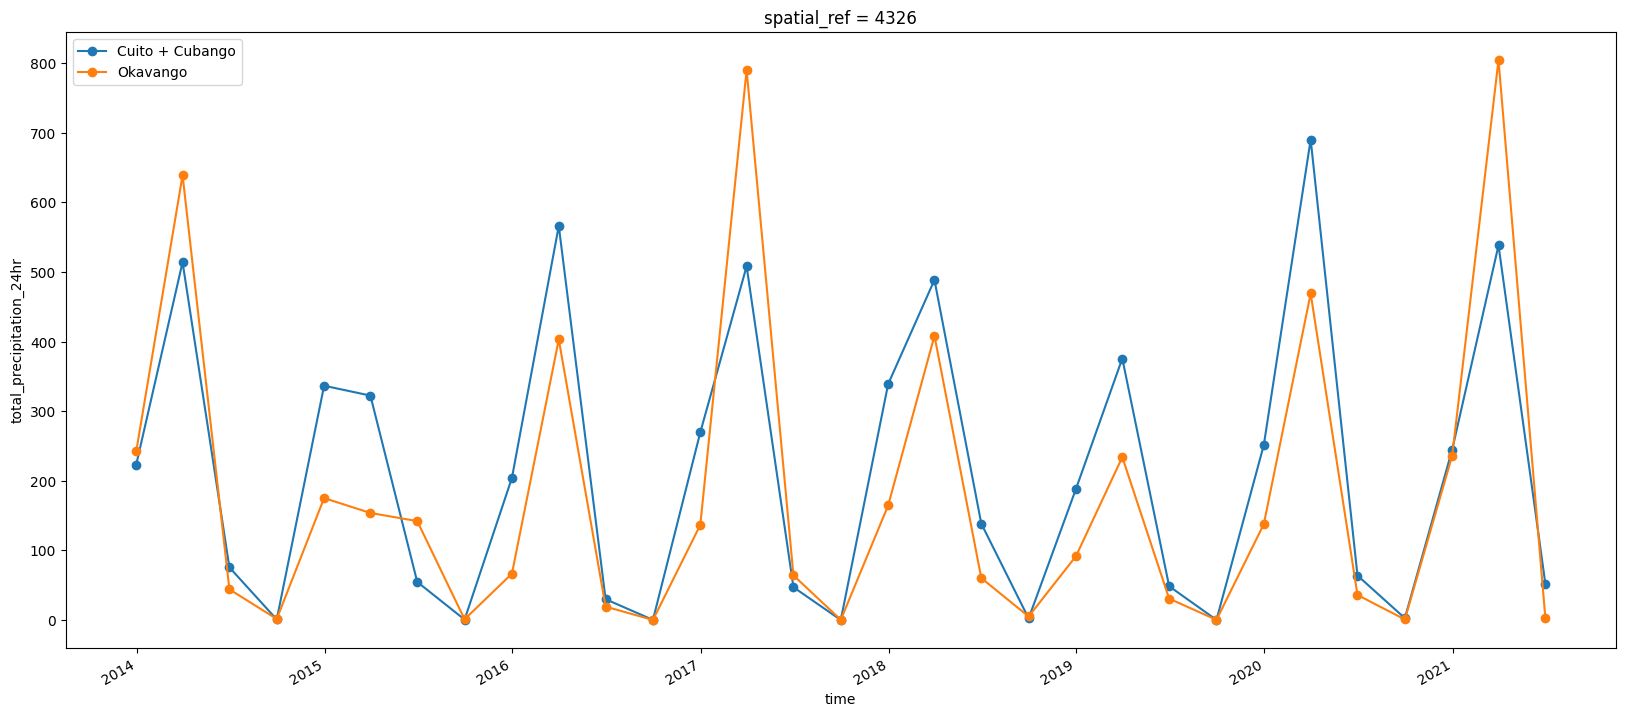
Visualize historical rainfall and compare to water extent changes
[10]:
upstream_rainfall.plot(label='Cuito + Cubango', marker='o', figsize=(20,8));
okavango_rainfall.plot(label='Okavango', marker='o');
plt.legend();
Additional information
License: The code in this notebook is licensed under the Apache License, Version 2.0. Digital Earth Africa data is licensed under the Creative Commons by Attribution 4.0 license.
Contact: If you need assistance, please post a question on the Open Data Cube Slack channel or on the GIS Stack Exchange using the open-data-cube tag (you can view previously asked questions here). If you would like to report an issue with this notebook, you can file one on
Github.
Compatible datacube version:
[11]:
print(datacube.__version__)
1.8.15
Last Tested:
[12]:
from datetime import datetime
datetime.today().strftime('%Y-%m-%d')
[12]:
'2024-02-01'