Monthly Normalised Difference Vegetation Index (NDVI) Anomaly
Date modified: March 2022
Service overview
Description
Digital Earth Africa’s Monthly NDVI Anomaly service provides estimate of vegetation condition, for each caldendar month, against the long-term baseline condition measured for the month from 1984 to 2020 in the NDVI Climatology.
A standardised anomaly is calculated by subtracting the long-term mean from an observation of interest and then dividing the result by the long-term standard deviation. The equation below applies for monthly NDVI anomalies:
\begin{equation} \text{Standardised anomaly }=\frac{NDVI_{month, year}-NDVI_{month}}{\sigma} \end{equation}
where \(NDVI_{month, year}\) is the NDVI measured for a month in a year, \(NDVI_{month}\) is the long-term mean for this month from 1984 to 2020, and \(\sigma\) is the long-term standard deviation. A standarised anomaly therefore measures the direction and significance of vegeation change against normal conditions.
Positive NDVI anomaly values indicate vegetation is greener than average conditions, and are usually due to increased rainfall in a region. Negative values indicate additional plant stress relative to the long-term average. The NDVI anomaly service is therefore effective for understanding the extent, intensity and impact of a drought.
Abrupt and significant negative anomalies may also be caused by fire disturbance.
A Jupyter Notebook which demonstrates loading and using this dataset in the Sandbox is also available.
The product is available on DE Africa Maps, which loads the product at the continental scale.
Specifications
Table 1: NDVI Anomaly specifications
Specification |
|
|---|---|
Product name |
|
Cell size - X (metres) |
30 |
Cell size - Y (metres) |
30 |
Coordinate reference system |
EPSG: 6933 |
Temporal resolution |
Monthly |
Temporal range |
2017 - now |
Parent dataset |
Landsat 8, 9, Sentinel-2 |
Update frequency |
Monthly |
From September 2022, the Monthly NDVI Anomaly is generated as a low latency product, i.e. anomaly for a month is generated on the 5th day of the following month. This ensures data is available shortly after the end of a month and all Landat 9 and Sentinel-2 observations are included. Not all landsat 8 observations for the month will be used, because the Landsat 8 Surface Refelectance product from USGS has a latency of over 2 weeks (see Landsat Collection 2 Generation Timeline).
From January 2017 to August 2022, all available Landsat 8, Landsat 9 and Sentinel-2 observations are used in the calculation of the anomalies.
Table 2: NDVI Anomaly measurements
Band ID |
Description |
Value range |
Data type |
NoData/Fill value |
|---|---|---|---|---|
ndvi_mean |
Mean NDVI for a month |
|
|
|
ndvi_std_anomaly |
Standardised NDVI anomaly for a month |
|
|
|
clear_count |
Number of clear observations in a month |
|
|
|
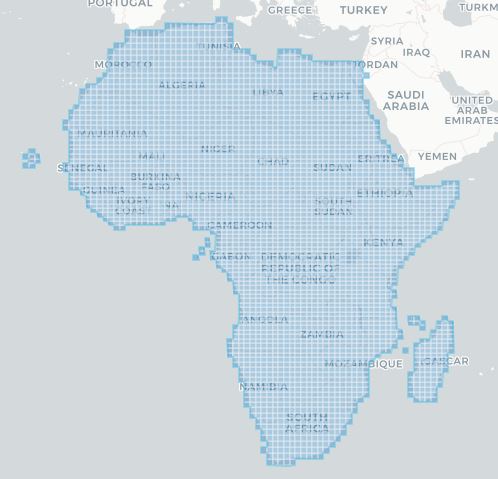
The specific temporal and geographic extents for the product can be explored as an interactive map on the Metadata Explorer. Data is available for the region shaded in blue.
Figure 1: The dataset coverage for the NDVI anomaly product
Media and example images
Image 1: Mean NDVI(left image) and Standardised NDVI Anomaly(right image) product at the Continental Level
Image 2: Mean NDVI(left image) and Standardised NDVI Anomaly(right image) product at the Northern part of Egypt
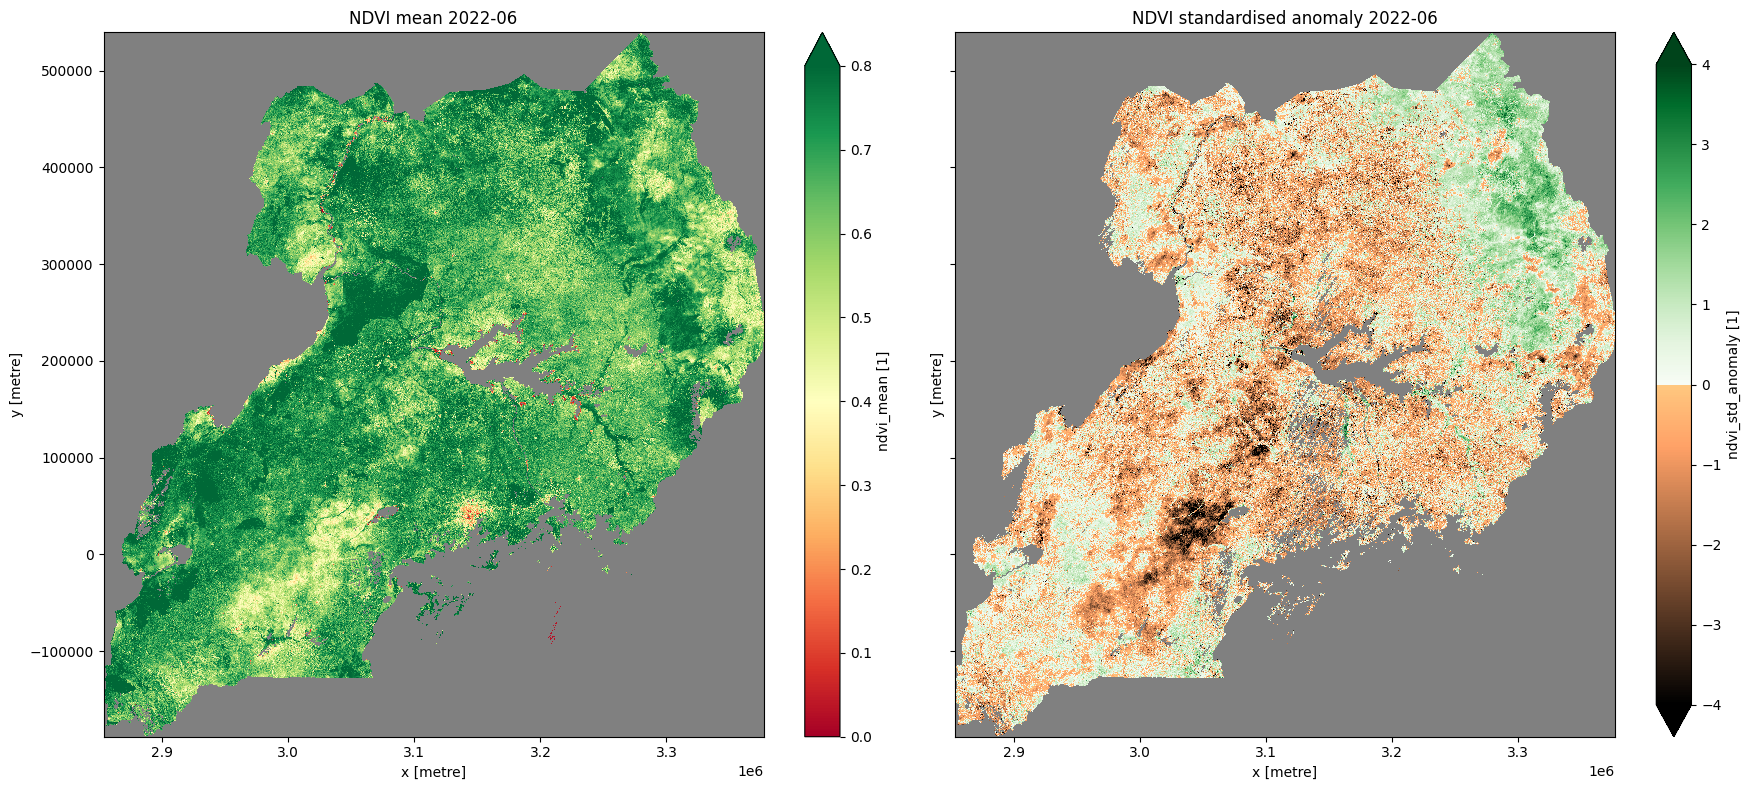
Image 3: Mean NDVI and NDVI anomaly for June 2022 over Uganda
License
CC BY Attribution 4.0 International License
Data Access
Amazon Web Services S3
The NDVI Anomaly service is available in AWS S3 thanks to the Public Dataset Program.
Table 3: AWS data access details
AWS S3 details |
|
|---|---|
Bucket ARN |
|
Product name |
|
The bucket is located in the region af-south-1 (Cape Town). Additional region specifications can be applied as follows:
aws s3 ls --region=af-south-1 s3://deafrica-services/ndvi_anomaly/
The file paths follow the format:
<productname>/<version>/<x>/<y>/<timeperiod>/<x><y>_<timeperiod>_<band>.<extension>
Table 4: AWS file path convention
File path element |
Description |
Example |
|---|---|---|
|
Product name |
|
|
Product version |
|
|
Tile number in the |
|
|
Tile number in the |
|
|
Year and month of data collection followed by period of time and time unit in the format |
|
|
File name. Combines |
Open Data Cube (ODC)
The NDVI Anomaly datasets can be accessed through the Digital Earth Africa ODC API, which is available through the Digital Earth Africa Sandbox.
ODC product name: ndvi_anomaly
For examples on how to use the ODC API, see the DE Africa example notebook repository.
OGC Web Services (OWS)
This service is available through DE Africa’s OWS.
Table 3: OWS data access details.
OWS details |
|
|---|---|
Name |
|
Web Map Services (WMS) URL |
|
Web Coverage Service (WCS) URL |
|
Layer names |
|
Digital Earth Africa OWS details can be found at https://ows.digitalearth.africa/.
For instructions on how to connect to OWS, see this tutorial.
Technical information
Limitations
Coverage and reliability of the NDVI Anomaly service depend on the availability and quality of both the NDVI Climatology and observations from the month of interest. Over equatorial Africa, the service is impacted by low quality of the long-term baseline and low number of cloud free images in a given month.
Currently, the NDVI Anomalies are calulated for locations with more than 10 clear historical observations.
Combining Sentinel-2 and Landsat
The mean NDVI value for a month of interest is calculated combining measurements from Landsat 8, Landsat 9 and Sentinel-2. For Landsat 8 and Landsat 9, NDVI is calculated using Band 5 (NIR) and Band 4 (Red). For Sentinel-2, NDVI is calculated using Band 8A (NIR narrow) and Band 4 (Red).
The code for reproducing the NDVI anomaly product is publicly availabe on github