
Shuttle Radar Topography Mission (SRTM) 1 Arc-Second Global Digital Elevation Model and DEM Derivatives#
Product overview#
Background#
The NASA Making Earth System Data Records for Use in Research Environments (MEaSUREs) Shuttle Radar Topography Mission (SRTM) global 1 arc second (~30 metre) DEM is archived and distributed by the Land Processes Distributed Active Archive Center (LP DAAC). This dataset is a result of a collaborative effort by the National Aeronautics and Space Administration (NASA) and the National Geospatial-Intelligence Agency (NGA – previously known as the National Imagery and Mapping Agency, or NIMA), as well as the participation of the German and Italian space agencies. The primary goal of creating this dataset was to eliminate voids that were present in earlier versions of the SRTM elevation data.
Digital Earth Africa provides free and open access to a copy of the NASA Version 3 SRTM DEM product over Africa.
Digital Earth Africa also produces and maintains free and open access to the SRTM DEM Derivatives product over Africa as a continental service.
These derivatives include slope, multi-resolution valley bottom flatness, multi-resolution ridge top flatness and topographic position. Slope and topographic position are provided at two spatial scales to represent local terrain variability and broader landform context. This product was generated by Digital Earth Africa from the Shuttle Radar Topography Mission (SRTM) v3.0 1 arc-second Digital Elevation Model.
A Jupyter Notebook which demonstrates loading and using DEM datasets in the Sandbox is also available.
Specifications#
Spatial and temporal coverage#
Relevant metadata for the SRTM DEM and the SRTM DEM derivatives products can be viewed on the DE Africa Metadata Explorer here and here.
Table 1: SRTM DEM and SRTM DEM Derivatives product specifications
Specification |
||
|---|---|---|
Product name |
|
|
Cell size - X |
0.000278° (~30 m) |
30 m |
Cell size - Y |
0.000278° (~30 m) |
30 m |
Coordinate reference system |
EPSG:4326 |
EPSG:6933 |
Temporal Resolution |
Multi-Day |
Multi-Day |
Temporal Extent |
2000-02-11 to 2000-02-21 |
2000-02-11 to 2000-02-21 |
Update frequency |
None |
None |
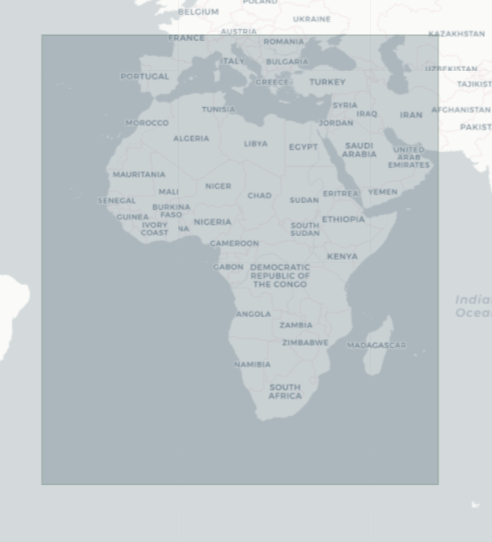
The specific temporal and geographic extents for the products can be explored as an interactive map on the Metadata Explorer here and here. Data is available for the regions shaded in blue.
Figure 1: SRTM DEM geographic extent
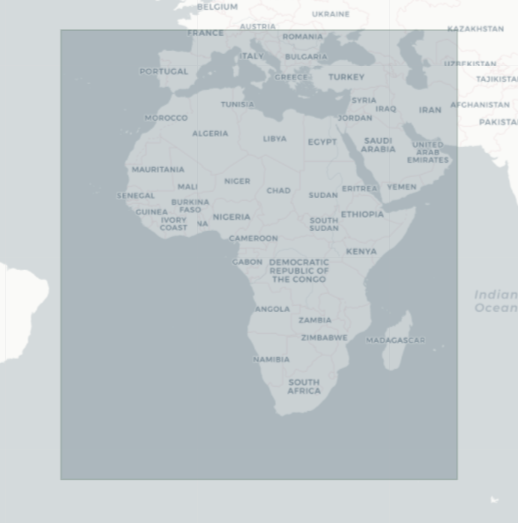
Figure 2: SRTM DEM Derivatives geographic extent
Measurements#
Table 2: SRTM DEM and SRTM DEM Derivatives product measurements
Product name |
Band ID |
Description |
Units |
Data type |
No data\(^\dagger\) |
|---|---|---|---|---|---|
|
elevation |
Elevation data. |
metre |
|
|
|
mrvbf |
Multi-resolution Valley Bottom Flatness (MrVBF): this identifies valley bottoms (areas of deposition). Zero values indicate erosional terrain and values ≥1 and indicate progressively larger areas of deposition. |
|
|
|
mrrtf |
Multi-resolution Ridge Top Flatness (MrRTF): complementary to MrVBF, zero values indicate areas that are steep or low, and values ≥1 indicate progressively larger areas of high flat land. |
|
|
|
|
slope_30m |
Slope (percent): The rate of elevation change representing fine-scale variation in terrain gradients. Derived using a \(3 \times 3\) moving window |
|
|
|
|
slope_270m |
Slope (percent): this is the rate of elevation change derived from a DEM smoothed using a \(9 \times 9\) moving window (~270 m). It represents generalized terrain gradients by reducing local variability and highlighting broader landform inclination. |
|
|
|
|
tpi_90m |
Topographic Position Index (TPI): this represents the difference between the elevation of a pixel and the mean elevation of its \(3 \times 3\) surrounding neighbourhood (~90 m). Positive values indicate areas higher than their immediate surroundings (ridges), while negative values indicate areas lower than their surroundings (depressions), representing terrain position at a local scale. |
|
|
|
|
tpi_270m |
Topographic Position Index (TPI): this represents the difference between the elevation of a pixel and the mean elevation of its \(9 \times 9\) surrounding neighbourhood (~270 m). Positive values indicate areas higher than their surroundings (ridges), while negative values indicate areas lower than their surroundings (valleys), representing terrain position within the broader landscape. |
|
|
|
\(^\dagger\) No data or fill value.
Processing#
The NASA Version 3.0 SRTM DEM is a void filled dataset. The missing data in the National Geospatial-Intelligence Agency (NGA) Version 2.0 SRTM DEM was filled using topographic data from non-SRTM sources. The primary fill elevation data was from the Terra Advanced Spaceborne Thermal Emission and Reflection Radiometer (ASTER) Global Digital Elevation Model Version 2.0 (GDEM2) and the secondary fill elevation data from the USGS Global Multi-resolution Terrain Elevation Data (GMTED2010) elevation model or the USGS National Elevation Dataset (NED). The SRTM Version 3.0 processing steps are detailed in The Shuttle Radar Topography Mission (SRTM) Collection User Guide.
The SRTM DEM Derivatives were generated by Digital Earth Africa from the SRTM v3.0 Digital Elevation Model. Slope and Topographic Position Index (TPI) were generated using gdaldem and additional moving window operations. Multi-resolution valley bottom flatness (MrVBF) and multi-resolution ridge top flatness (MrRTF) were derived using the SAGA GIS tool (Version: 2.3.1).
At the native resolution, both slope and TPI are computed using a \(3 \times 3\) neighbourhood. For slope, this represents the terrain gradient at the pixel scale (~30 m), as the window is used to estimate a local derivative at the centre pixel. For TPI, the same \(3 \times 3\) neighbourhood defines the surrounding area against which the pixel is compared, resulting in a spatial support of approximately 90 m.
Broader-scale derivatives were generated using a \(9 \times 9\) moving window (~270 m). For slope, this was achieved by first smoothing the DEM using a \(9 \times 9\) moving window mean filter and then computing slope, resulting in a generalized representation of terrain gradients that reduces local variability. For TPI, the \(9 \times 9\) neighbourhood was used directly to compute the mean surrounding elevation, providing a measure of terrain position relative to the broader landscape.
The scripts used to generate the derivatives are available here.
Media and example images#
Figure 3: SRTM DEM elevation data for Mt. Kenya

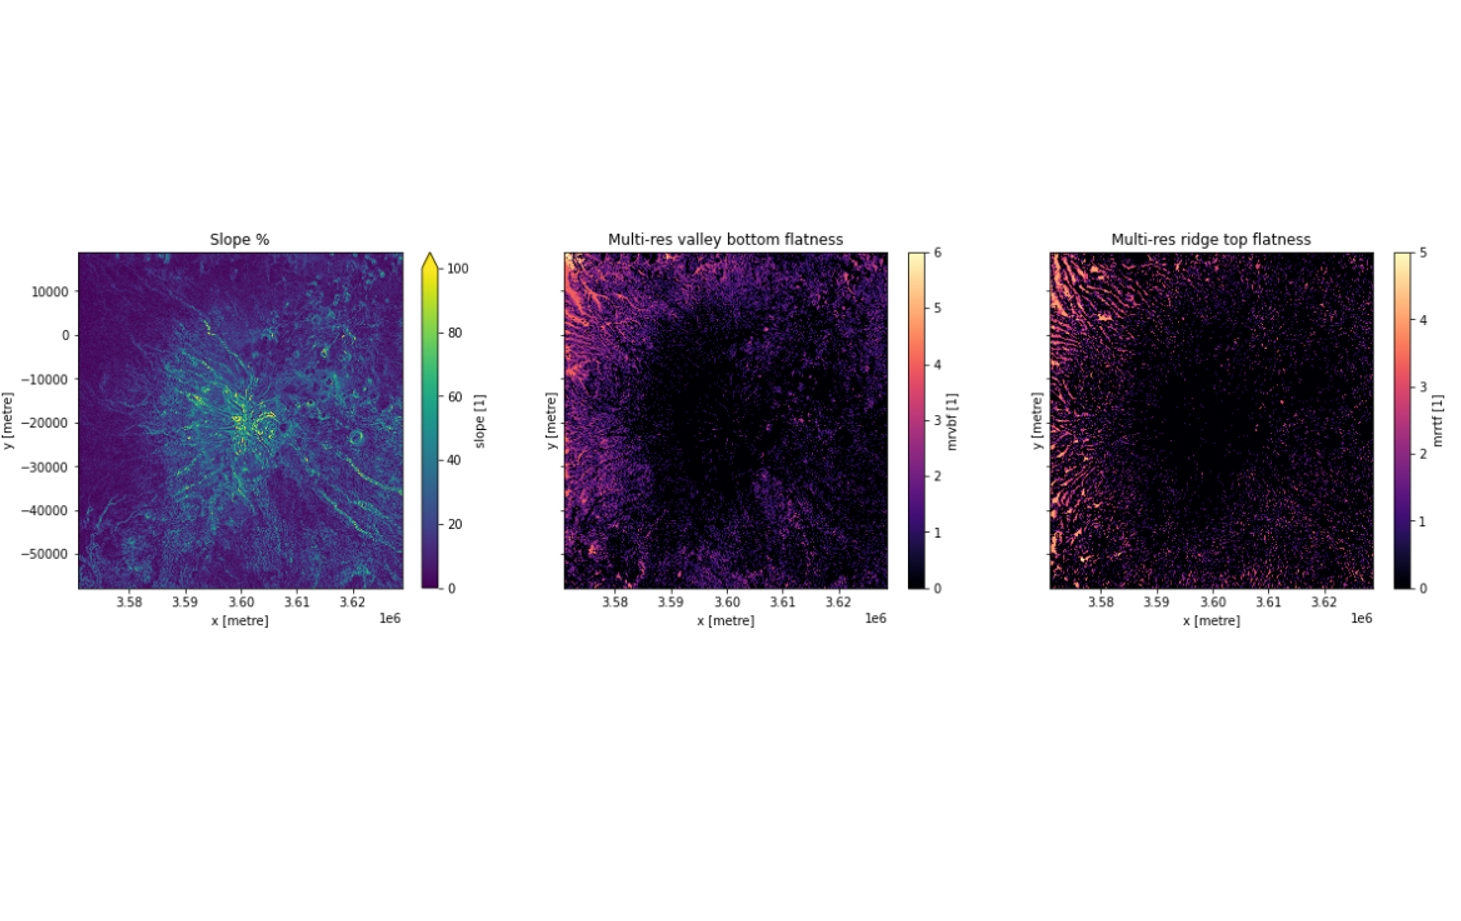
Figure 4: SRTM DEM Derivatives for Mt. Kenya
References#
G., Rosen, P. A., Caro, E., Crippen, R., Duren, R., Hensley, S., Kobrick, M., Paller, M., Rodriguez, E., Roth, L., Seal, D., Shaffer, S., Shimada, J., Umland, J., Werner, M., Oskin, M., Burbank, D., & Alsdorf, D. (2007). The Shuttle Radar Topography Mission. In Reviews of Geophysics (Vol. 45, Issue 2). American Geophysical Union (AGU). https://doi.org/10.1029/2005rg000183
The Shuttle Radar Topography Mission (SRTM) Collection User Guide
License and Acknowledgements#
The SRTM DEM is available under a CC-BY-4.0 license.
The Digital Earth Africa SRTM DEM Derivatives product is provided free of charge, under a Apache License 2.0 license.
Data Access#
Amazon web services S3#
The SRTM DEM and SRTM DEM Derivatives are available in AWS S3.
Table 3: SRTM DEM and SRTM DEM Derivatives AWS data access details
AWS S3 details |
||
|---|---|---|
Product |
SRTM DEM |
SRTM DEM Derivatives |
Bucket ARD |
|
|
Region |
|
|
The bucket is in the AWS region af-south-1 (Cape Town). Additional region specifications can be applied as follows:
aws s3 ls --region=af-south-1 s3://deafrica-input-datasets/
The SRTM DEM file path is: strm_dem/dem_srtm. The SRTM Derivatives file path is: srtm_dem/dem_srtm_deriv.
OGC Web Services (OWS)#
The SRTM DEM and SRTM DEM Derivatives are available through DE Africa’s OWS.
Table 5: OWS data access details.
OWS details |
|
|---|---|
Name |
|
Web Map Services (WMS) URL |
|
Web Coverage Service (WCS) URL |
|
Layer names |
|
Digital Earth Africa OWS details can be found at https://ows.digitalearth.africa/.
For instructions on how to connect to OWS, see this tutorial.
Open Data Cube (ODC)#
The SRTM DEM and SRTM DEM Derivatives can be accessed through the Digital Earth Africa ODC API, which is available through the Digital Earth Africa Sandbox.
ODC product names: dem_srtm, dem_srtm_deriv
Specific bands of data can be called by using either the default names or any of a band’s alternative names, as listed in the table below. ODC Datacube.load commands without specified bands will load all bands.
Table 6: ODC products dem_srtm and dem_srtm_deriv band names
Product |
Band name |
Alternative names |
Fill value |
|---|---|---|---|
|
elevation |
NaN |
|
|
mrvbf |
NaN |
|
mrrtf |
NaN |
|
|
slope_30m |
NaN |
|
|
slope_270m |
NaN |
|
|
tpi_90m |
NaN |
|
|
tpi_270m |
NaN |
|
Technical information#
The Kinematic Global Positioning System Geodetic field surveying method was used to validate SRTM data. About 70,000 kilometers of survey lines were collected. The data was used to model long-wavelength error sources. In addition, NASA’s JPL deployed corner reflectors during the SRTM mission which were deployed with precisely measured coordinates and served as control points in the SRTM data.
Known issues in the NASA SRTM are described in the following publication:
Rodriguez, E., C. S. Morris, and J. E. Belz (2006), A global assessment of the SRTM performance, Photogramm. Eng. Remote Sens., 72, 249–260. https://doi.org/10.14358/PERS.72.3.249.