Indice de végétation par différence normalisée (NDVI) Climatologie
Date de modification : février 2022
Aperçu du service
Description
Le produit climatologique NDVI de Digital Earth Africa représente l’état de référence moyen à long terme de la végétation pour chaque pixel Landsat sur le continent africain. Les climatologies NDVI moyennes et à écart type sont disponibles pour chaque mois du calendrier.
Certaines caractéristiques clés du produit sont :
Les climatologies NDVI ont été développées à l’aide d’images satellites Landsat 5, 7 et 8 harmonisées.
Les climatologies NDVI moyennes et d’écart type sont produites pour chaque mois calendaire, en utilisant une période de référence temporelle de 1984 à 2020 (inclus)
Les ensembles de données ont une résolution spatiale de 30 mètres
Le produit contient 36 mesures, réparties sur trois catégories de données (12 mesures dans chaque catégorie, une pour chaque mois) :
« mean_<month> » : ces mesures montrent le NDVI moyen calculé à partir de toutes les données NDVI disponibles de 1984 à 2020 pour le mois donné.
stddev_<mois>: ces mesures montrent l’écart type des valeurs NDVI de toutes les données NDVI disponibles de 1984 à 2020 pour le mois donné.« count_<mois> » : ces mesures montrent le nombre d’observations claires qui entrent dans la création des mesures de moyenne et d’écart type.
Remarque importante : En raison de la disponibilité incohérente des données de Landsat 5 sur l’Afrique équatoriale et de la couverture nuageuse persistante sur ces mêmes régions, la qualité de la ligne de base NDVI à long terme est médiocre en Afrique équatoriale. Nous recommandons de ne pas utiliser le produit dans les endroits où le nombre d’observations claires est inférieur à environ 30 observations. En dessous de ce chiffre, les couches d’écart type sont sujettes à des artefacts de données en raison des opérations de lissage temporel qui fonctionnent mal sur des ensembles de données épars et des pixels nuageux résiduels qui ne sont pas suffisamment « moyennés » par un volume décent de données d’entrée.
Un Jupyter Notebook qui démontre le chargement et l’utilisation de cet ensemble de données dans le Sandbox est également disponible.
Spécifications
Tableau 1 : Spécifications de climatologie NDVI
Spécification |
|
|---|---|
Nom du produit |
|
Taille de la cellule - X (mètres) |
30 |
Taille de la cellule - Y (mètres) |
30 |
Système de référence de coordonnées |
EPSG: 6933 |
Résolution temporelle |
N / A |
Plage temporelle |
1984-2020 |
Ensemble de données parent |
Landsat 5,7,8 |
Fréquence de mise à jour |
N / A |
Tableau 2 : Mesures climatologiques NDVI
ID de la bande |
Description |
Plage de valeurs |
Type de données |
Valeur NoData/Fill |
|---|---|---|---|---|
moyenne_jan |
NDVI moyen pour janvier (1984-2020) |
« 0 - 1 » |
|
|
moyenne_février |
NDVI moyen pour février (1984-2020) |
« 0 - 1 » |
|
|
moyenne_mar |
NDVI moyen pour mars (1984-2020) |
« 0 - 1 » |
|
|
moyenne_avril |
NDVI moyen pour avril (1984-2020) |
« 0 - 1 » |
|
|
moyenne_peut |
NDVI moyen pour mai (1984-2020) |
« 0 - 1 » |
|
|
moyenne_juin |
NDVI moyen pour juin (1984-2020) |
« 0 - 1 » |
|
|
moyenne_juillet |
NDVI moyen pour juillet (1984-2020) |
« 0 - 1 » |
|
|
moyenne_août |
NDVI moyen pour août (1984-2020) |
« 0 - 1 » |
|
|
moyenne_sep |
NDVI moyen pour septembre (1984-2020) |
« 0 - 1 » |
|
|
moyenne_oct |
NDVI moyen pour octobre (1984-2020) |
« 0 - 1 » |
|
|
moyenne_nov |
NDVI moyen pour novembre (1984-2020) |
« 0 - 1 » |
|
|
moyenne_déc |
NDVI moyen pour décembre (1984-2020) |
« 0 - 1 » |
|
|
stddev_jan |
Écart type du NDVI pour janvier (1984-2020) |
« 0 - 1 » |
|
|
stddev_février |
Écart type du NDVI pour février (1984-2020) |
« 0 - 1 » |
|
|
stddev_mar |
Écart type du NDVI pour mars (1984-2020) |
« 0 - 1 » |
|
|
stddev_apr |
Écart type du NDVI pour avril (1984-2020) |
« 0 - 1 » |
|
|
stddev_mai |
Écart type du NDVI pour mai (1984-2020) |
« 0 - 1 » |
|
|
stddev_jun |
Écart type du NDVI pour juin (1984-2020) |
« 0 - 1 » |
|
|
stddev_jul |
Écart type du NDVI pour juillet (1984-2020) |
« 0 - 1 » |
|
|
stddev_aug |
Écart type du NDVI pour août (1984-2020) |
« 0 - 1 » |
|
|
stddev_sep |
Écart type du NDVI pour septembre (1984-2020) |
« 0 - 1 » |
|
|
stddev_oct |
Écart type du NDVI pour octobre (1984-2020) |
« 0 - 1 » |
|
|
stddev_nov |
Écart type du NDVI pour novembre (1984-2020) |
« 0 - 1 » |
|
|
stddev_déc |
Écart type du NDVI pour décembre (1984-2020) |
« 0 - 1 » |
|
|
compte_jan |
Nombre d’observations claires en janvier (1984-2020) |
|
|
|
compte_fév |
Nombre d’observations claires en février (1984-2020) |
|
|
|
compte_mar |
Nombre d’observations claires en mars (1984-2020) |
|
|
|
compte_avril |
Nombre d’observations claires en avril (1984-2020) |
|
|
|
compter_peut |
Nombre d’observations claires en mai (1984-2020) |
|
|
|
compte_juin |
Nombre d’observations claires en juin (1984-2020) |
|
|
|
compte_juillet |
Nombre d’observations claires en juillet (1984-2020) |
|
|
|
compte_août |
Nombre d’observations claires en août (1984-2020) |
|
|
|
compte_sep |
Nombre d’observations claires en septembre (1984-2020) |
|
|
|
compte_oct |
Nombre d’observations claires en octobre (1984-2020) |
|
|
|
compte_nov |
Nombre d’observations claires en novembre (1984-2020) |
|
|
|
compte_déc |
Nombre d’observations claires en décembre (1984-2020) |
|
|
|
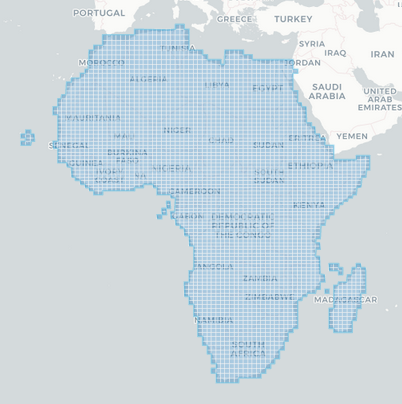
Les étendues temporelles et géographiques spécifiques du produit peuvent être explorées sous forme de carte interactive dans l’explorateur de métadonnées <https://explorer.digitalearth.africa/products/ndvi_climatology_ls>. Les données sont disponibles pour la région ombrée en bleu.
Figure 1 : Couverture de l’ensemble de données pour le produit Climatologie NDVI
Médias et exemples d’images
Image 1 : Animations des couches de climatologie NDVI. À gauche : NDVI moyen ; à droite : NDVI écart-type
Licence
Licence internationale CC BY Attribution 4.0
Accès aux données
Amazon Web Services S3
Le service de climatologie NDVI est disponible dans AWS S3 grâce au programme Public Dataset.
Tableau 3 : Détails de l’accès aux données AWS
Détails AWS S3 |
|
|---|---|
ARN du compartiment |
|
Nom du produit |
|
Le bucket est situé dans la région « af-south-1 » (Le Cap). Des spécifications régionales supplémentaires peuvent être appliquées comme suit :
aws s3 ls --region=af-sud-1 s3://deafrica-services/ndvi_climatology_ls/
Les chemins d’accès aux fichiers suivent le format :
<nom du produit>/<version>/<x>/<y>/<période>/<x><y>_<période>_<bande>.<extension>
Tableau 4 : Convention de chemin d’accès au fichier AWS
Élément de chemin de fichier |
Description |
Exemple |
|---|---|---|
|
Nom du produit |
|
|
Version du produit |
« 1.0.0 » |
|
Numéro de tuile dans la direction « x ». |
|
|
Numéro de tuile dans la direction « y ». |
|
« période de temps » |
Année de collecte des données suivie de la période et de l’unité de temps au format « AAAA–P<période><unité> ». Les unités de temps sont désignées par des lettres majuscules, « Y » pour les années et « M » pour les mois. |
« 1984–P37Y » |
|
Nom de fichier. Combine « x », « y », « timeperiod » avec « band », en utilisant les identifiants de bande et les extensions de fichier. Pour la plupart des tuiles, l’extension de fichier est « .tif ». |
Open Data Cube (ODC)
Les ensembles de données de climatologie NDVI sont accessibles via l’API ODC de Digital Earth Africa, qui est disponible via le « Digital Earth Africa Sandbox <https://sandbox.digitalearth.africa/hub/login> »__.
Nom du produit ODC : ndvi_climatology_ls
Pour des exemples sur la façon d’utiliser l’API ODC, consultez le référentiel de blocs-notes d’exemples DE Africa <https://github.com/digitalearthafrica/deafrica-sandbox-notebooks>`__.
Services Web OGC (OWS)
Ce service est disponible via OWS de DE Africa.
Tableau 5 : Détails d’accès aux données OWS.
Détails de l’OWS |
|
|---|---|
Nom |
« DE Africa Services » |
URL des services de cartographie Web (WMS) |
|
URL du service de couverture Web (WCS) |
|
Noms des calques |
|
Les détails de Digital Earth Africa OWS peuvent être trouvés sur https://ows.digitalearth.africa/.
Pour obtenir des instructions sur la façon de se connecter à OWS, consultez « ce tutoriel <../web_services/index.ipynb> ».
Informations techniques
Méthode d’harmonisation Landsat
Les satellites Landsat possèdent l’enregistrement temporel le plus long des données d’observation de la Terre, couvrant près de quatre décennies et incluant Landsat 5, 7 et 8 (et maintenant Landsat 9). Idéalement, l’enregistrement des données Landsat devrait être cohérent sur l’ensemble des séries de capteurs Landsat, mais l’imageur terrestre opérationnel Landsat-8 (OLI) a amélioré l’étalonnage par rapport au précédent Landsat-7 Enhanced Thematic Mapper (ETM +) et à l’ETM de Landsat 5. Les différentes qualités des capteurs peuvent entraîner des discontinuités lors de la concaténation des séries temporelles NDVI entre différents capteurs.
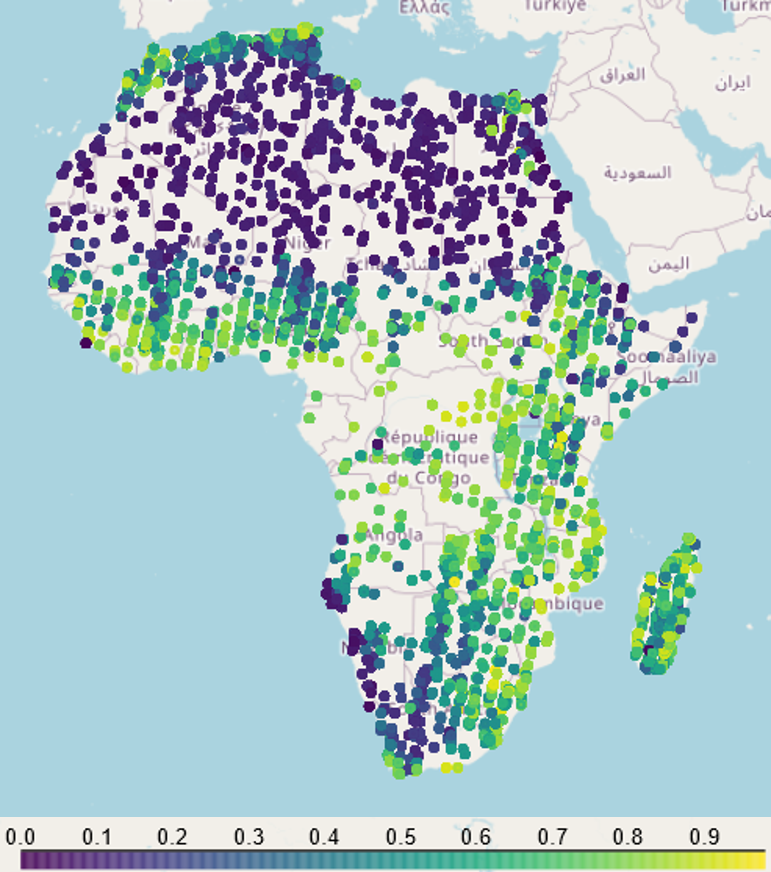
Afin d’harmoniser les différentes générations de capteurs Landsat, 10 000 polygones de 60 x 60 m ont été répartis aléatoirement sur le continent. À chaque emplacement d’échantillonnage, une série chronologique de quatre ans (2013-2016) d’images Landsat 7 et Landsat 8 masquées par les nuages a été chargée, et les observations NDVI Landsat 7 et Landsat 8 coïncidentes ont été conservées. La coïncidence est définie ici comme des acquisitions prises à deux jours d’intervalle. Au total, 35 189 observations de pixels coïncidentes ont été collectées (tous les pixels dans les polygones de 60 x 60 m ont été conservés).
Figure 1 : Emplacements des images coïncidentes de Landsat 7 et Landsat 8 utilisées pour définir les coefficients d’harmonisation dans l’équation 2. Les points sont colorés par la valeur NDVI de l’image Landsat 8.
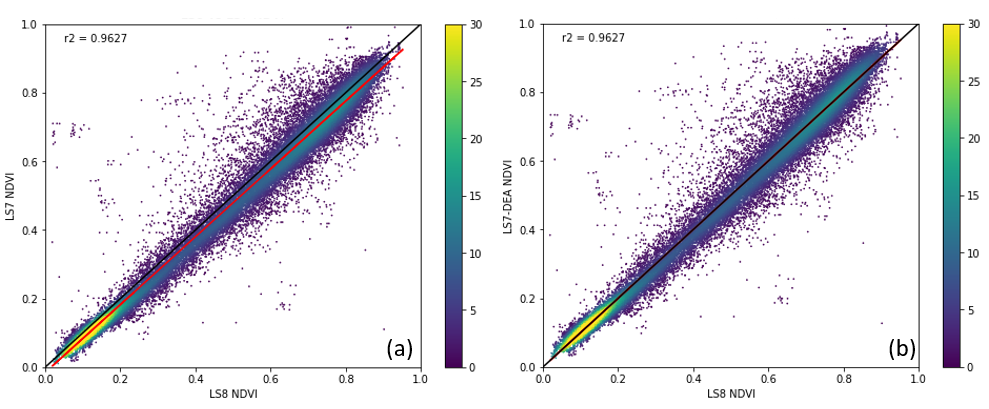
Des échantillons coïncidents ont été utilisés pour effectuer une régression linéaire entre le NDVI de Landsat 8 et le NDVI de Landsat 7. Les résultats sont présentés dans la figure 2a sous forme de diagramme de dispersion de densité. La relation linéaire (équation 1.) entre les deux est exprimée comme suit (également représentée par la ligne rouge dans la figure 2a) :
eq.1: NDVI_LS7 = 0.988 * NDVI_LS8 -0.015
Afin d’harmoniser les ensembles de données, Landsat 7 a été transformé pour mieux s’aligner sur Landsat 8 en utilisant l’équation 2. La figure 2b représente les résultats après harmonisation.
eq.2: NDVI_LS7_harmonized = (NDVI_LS7 + 0.015) / 0.988
Figure 2 : a) Diagrammes de dispersion de la densité entre le NDVI de Landsat 7 et le NDVI de Landsat 8 avant harmonisation. La ligne rouge montre la relation linéaire et la ligne noire montre la ligne 1:1. b) Diagrammes de dispersion de la densité entre le NDVI de Landsat 7 et le NDVI de Landsat 8 après harmonisation. La ligne rouge se trouve directement au-dessus de la ligne 1:1
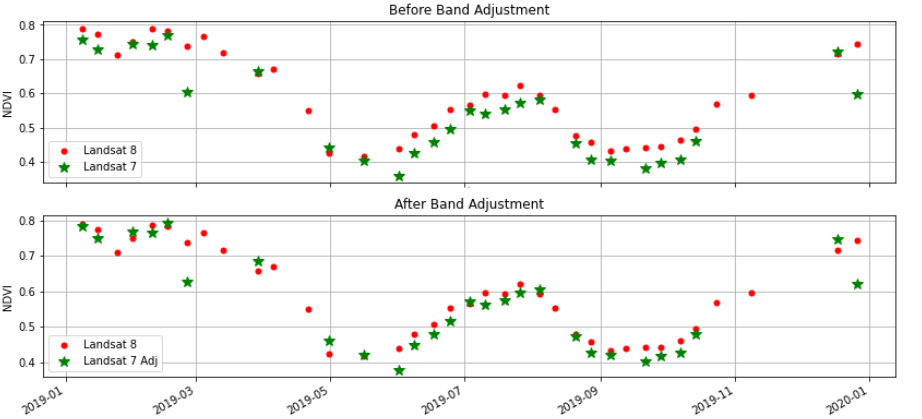
Nous pouvons visualiser comment l’harmonisation améliore la cohérence entre les capteurs en traçant une série chronologique de NDVI avant et après l’harmonisation (figure 3).
Figure 3 : Impact de l’harmonisation de Landsat 7 sur une série temporelle d’indices de végétation naturelle (NDVI). La série temporelle provient d’une région de culture irriguée en Égypte.
Algorithme de climatologie NDVI
La procédure de calcul des climatologies NDVI est décrite étape par étape ci-dessous. Le code permettant de reproduire le produit de climatologie NDVI est disponible publiquement sur github <https://github.com/digitalearthafrica/ndvi-anomalies>`__:
Charger une série temporelle concaténée Landsat 5 et Landsat 7
Masquer les pixels dans LS5 et LS7 où :
nuage, et les ombres des nuages se produisent, et appliquent les opérateurs morphologiques ouverture + dilatation (améliore le masque des nuages)
Valeurs de réflectance de surface > 65 455 ou < 7 272,72
La réflectance de la surface de la bande bleue est > 20 910 (supprime certains nuages manqués par Fmask)
Charger la série temporelle Landsat 8
Masquer les pixels dans LS8 où :
des nuages, des ombres de nuages et des cirrus se produisent et appliquent les opérateurs morphologiques ouverture + dilatation (améliore le masque de nuage)
Valeurs de réflectance de surface > 65 455 ou < 7 272,72
La réflectance de la surface de la bande bleue est > 20 910 (supprime certains nuages manqués par fmask)
Calculer le NDVI pour chaque capteur
Ajustez Landsat 5-7 en utilisant « eq. 2 ».
Fusionner les séries chronologiques Landsat 5-7 avec les séries chronologiques Landsat 8
Définir comme pixels sans données où le NDVI n’est pas compris entre 0 et 1
Appliquer un filtre temporel moyen glissant (taille de la fenêtre = 3) pour réduire l’influence du bruit et des nuages manqués dans la série chronologique
Calculer la moyenne mensuelle et l’écart type des climatologies NDVI.