Anomalie de l’indice de végétation différentiel normalisé mensuel (NDVI)
Date de modification : mars 2022
Aperçu du service
Description
Le service d’anomalie mensuelle NDVI de Digital Earth Africa fournit une estimation de l’état de la végétation, pour chaque mois calendaire, par rapport à l’état de référence à long terme mesuré pour le mois de 1984 à 2020 dans la « Climatologie NDVI <https://docs.digitalearthafrica.org/en/latest/data_specs/NDVI_Climatology_specs.html> »__.
Une anomalie standardisée est calculée en soustrayant la moyenne à long terme d’une observation d’intérêt, puis en divisant le résultat par l’écart type à long terme. L’équation ci-dessous s’applique aux anomalies mensuelles du NDVI :
\begin{equation} \text{Anomalie normalisée}=\frac{NDVI_{mois, année}-NDVI_{mois}}{\sigma} \end{equation}
où \(NDVI_{mois, année}\) est le NDVI mesuré pour un mois de l’année, \(NDVI_{mois}\) est la moyenne à long terme pour ce mois de 1984 à 2020, et \(\sigma\) est l’écart type à long terme. Une anomalie normalisée mesure donc la direction et l’importance du changement de végétation par rapport aux conditions normales.
Les valeurs d’anomalie NDVI positives indiquent que la végétation est plus verte que la moyenne et sont généralement dues à une augmentation des précipitations dans une région. Les valeurs négatives indiquent un stress supplémentaire des plantes par rapport à la moyenne à long terme. Le service d’anomalie NDVI est donc efficace pour comprendre l’étendue, l’intensité et l’impact d’une sécheresse.
Des anomalies négatives abruptes et importantes peuvent également être provoquées par des perturbations causées par le feu.
Un Jupyter Notebook qui démontre le chargement et l’utilisation de cet ensemble de données dans le Sandbox est également disponible.
Le produit est disponible sur DE Africa Maps, qui charge le produit à l’échelle continentale.
Spécifications
Tableau 1 : Spécifications des anomalies NDVI
Spécification |
|
|---|---|
Nom du produit |
|
Taille de la cellule - X (mètres) |
30 |
Taille de la cellule - Y (mètres) |
30 |
Système de référence de coordonnées |
EPSG: 6933 |
Résolution temporelle |
Mensuel |
Plage temporelle |
2017 - maintenant |
Ensemble de données parent |
Landsat 8, 9, Sentinelle-2 |
Fréquence de mise à jour |
Mensuel |
À partir de septembre 2022, l’anomalie mensuelle NDVI est générée sous forme de produit à faible latence, c’est-à-dire que l’anomalie d’un mois est générée le 5e jour du mois suivant. Cela garantit que les données sont disponibles peu de temps après la fin d’un mois et que toutes les observations Landat 9 et Sentinel-2 sont incluses. Toutes les observations Landsat 8 du mois ne seront pas utilisées, car le produit Landsat 8 Surface Reflectance de l’USGS a une latence de plus de 2 semaines (voir Landsat Collection 2 Generation Timeline).
De janvier 2017 à août 2022, toutes les observations disponibles de Landsat 8, Landsat 9 et Sentinel-2 sont utilisées dans le calcul des anomalies.
Tableau 2 : Mesures d’anomalies NDVI
ID de la bande |
Description |
Plage de valeurs |
Type de données |
Valeur NoData/Fill |
|---|---|---|---|---|
ndvi_moyenne |
NDVI moyen pour un mois |
« 0 - 1 » |
|
|
anomalie_std_ndvi |
Anomalie NDVI standardisée pour un mois |
« 0 - 1 » |
|
|
effacer_compter |
Nombre d’observations claires en un mois |
|
|
|
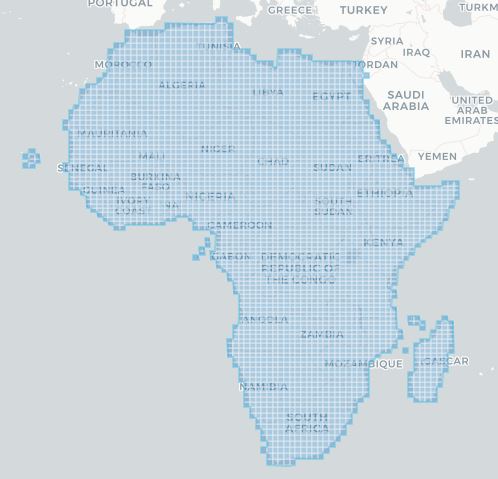
Les étendues temporelles et géographiques spécifiques du produit peuvent être explorées sous forme de carte interactive dans l’explorateur de métadonnées <https://explorer.digitalearth.africa/products/ndvi_anomaly>. Les données sont disponibles pour la région ombrée en bleu.
Figure 1 : Couverture de l’ensemble de données pour le produit d’anomalie NDVI
Médias et exemples d’images
Image 1 : Produit NDVI moyen (image de gauche) et anomalie NDVI standardisée (image de droite) au niveau continental
Image 2 : Produit NDVI moyen (image de gauche) et anomalie NDVI standardisée (image de droite) dans la partie nord de l’Égypte
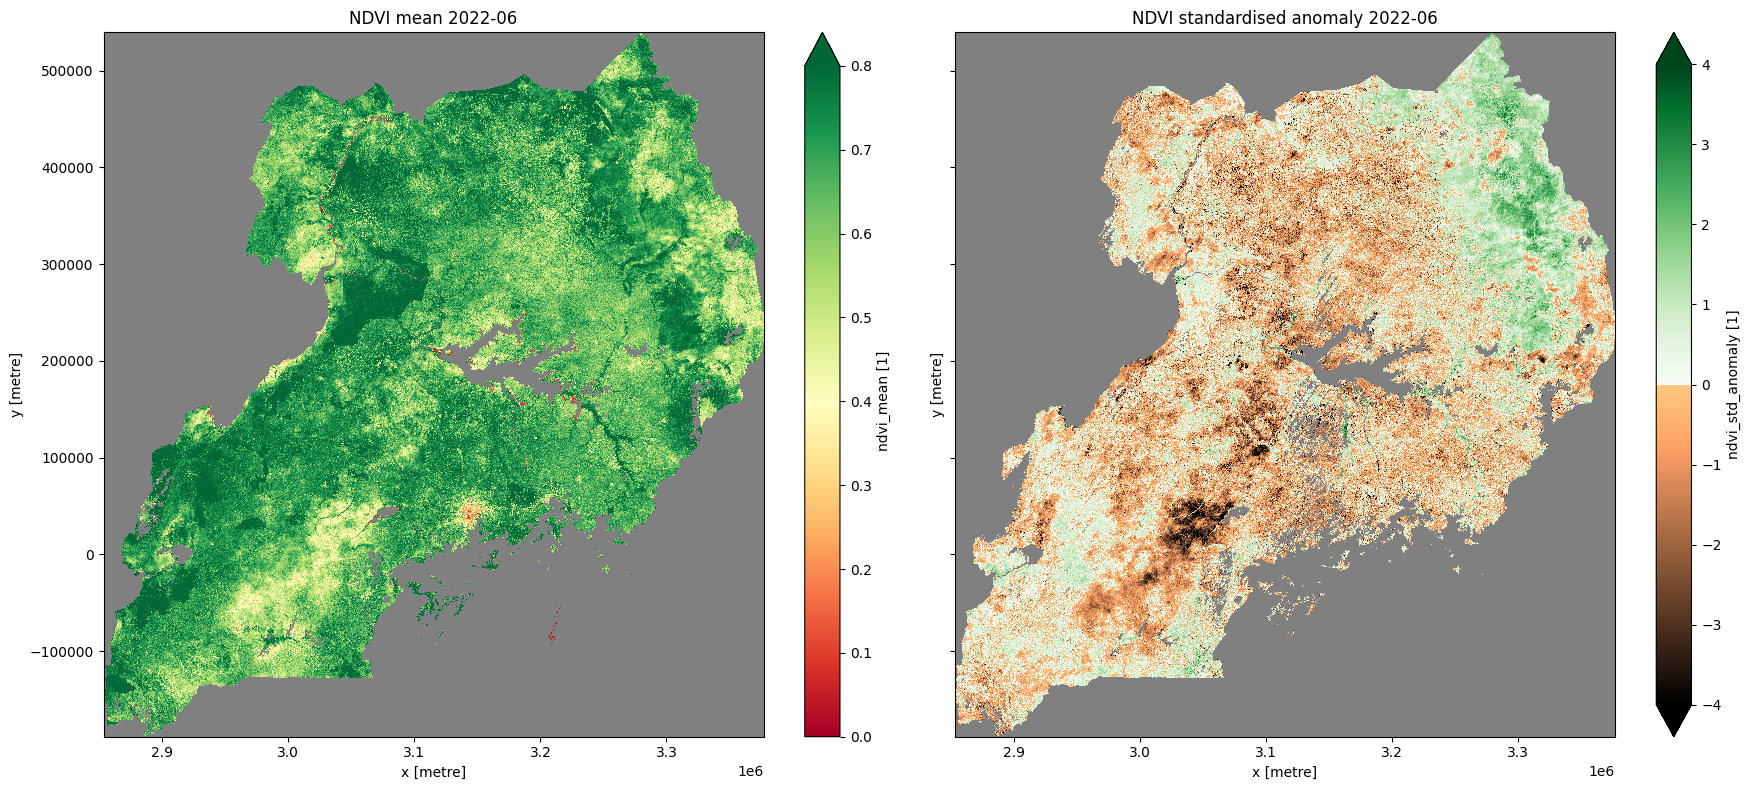
Image 3 : NDVI moyen et anomalie NDVI pour juin 2022 en Ouganda
Licence
Licence internationale CC BY Attribution 4.0
Accès aux données
Amazon Web Services S3
Le service NDVI Anomaly est disponible dans AWS S3 grâce au programme Public Dataset.
Tableau 3 : Détails de l’accès aux données AWS
Détails AWS S3 |
|
|---|---|
ARN du compartiment |
|
Nom du produit |
|
Le bucket est situé dans la région « af-south-1 » (Le Cap). Des spécifications régionales supplémentaires peuvent être appliquées comme suit :
aws s3 ls --region=af-sud-1 s3://deafrica-services/ndvi_anomaly/
Les chemins d’accès aux fichiers suivent le format :
<nom du produit>/<version>/<x>/<y>/<période>/<x><y>_<période>_<bande>.<extension>
Tableau 4 : Convention de chemin d’accès au fichier AWS
Élément de chemin de fichier |
Description |
Exemple |
|---|---|---|
|
Nom du produit |
|
|
Version du produit |
« 1.0.0 » |
|
Numéro de tuile dans la direction « x ». |
|
|
Numéro de tuile dans la direction « y ». |
|
« période de temps » |
Année et mois de collecte des données suivis de la période et de l’unité de temps au format « AAAA-MM–P<période><unité> ». Les unités de temps sont désignées par des lettres majuscules, « Y » pour les années et « M » pour les mois. |
|
|
Nom de fichier. Combine « x », « y », « timeperiod » avec « band », en utilisant les identifiants de bande et les extensions de fichier. Pour la plupart des tuiles, l’extension de fichier est « .tif ». |
Open Data Cube (ODC)
Les ensembles de données d’anomalies NDVI sont accessibles via l’API ODC de Digital Earth Africa, qui est disponible via le « Digital Earth Africa Sandbox <https://sandbox.digitalearth.africa/hub/login> »__.
Nom du produit ODC : « ndvi_anomaly »
Pour des exemples sur la façon d’utiliser l’API ODC, consultez le référentiel de blocs-notes d’exemples DE Africa <https://github.com/digitalearthafrica/deafrica-sandbox-notebooks>`__.
Services Web OGC (OWS)
Ce service est disponible via OWS de DE Africa.
Tableau 3 : Détails d’accès aux données OWS.
Détails de l’OWS |
|
|---|---|
Nom |
« DE Africa Services » |
URL des services de cartographie Web (WMS) |
|
URL du service de couverture Web (WCS) |
|
Noms des calques |
|
Les détails de Digital Earth Africa OWS peuvent être trouvés sur https://ows.digitalearth.africa/.
Pour obtenir des instructions sur la façon de se connecter à OWS, consultez « ce tutoriel <../web_services/index.ipynb> ».
Informations techniques
Limites
La couverture et la fiabilité du service d’anomalies NDVI dépendent de la disponibilité et de la qualité de la climatologie NDVI et des observations du mois d’intérêt. Sur l’Afrique équatoriale, le service est affecté par la faible qualité de la ligne de base à long terme et par le faible nombre d’images sans nuages au cours d’un mois donné.
Actuellement, les anomalies NDVI sont calculées pour les emplacements avec plus de 10 observations historiques claires.
Combinaison de Sentinel-2 et de Landsat
La valeur moyenne du NDVI pour un mois d’intérêt est calculée en combinant les mesures de Landsat 8, Landsat 9 et Sentinel-2. Pour Landsat 8 et Landsat 9, le NDVI est calculé à l’aide de la bande 5 (NIR) et de la bande 4 (Rouge). Pour Sentinel-2, le NDVI est calculé à l’aide de la bande 8A (NIR étroit) et de la bande 4 (Rouge).
Le code permettant de reproduire le produit d’anomalie NDVI est disponible publiquement sur github <https://github.com/digitalearthafrica/ndvi-anomalies>`__