Précipitations - Groupe des risques climatiques Précipitations infrarouges avec données de station (CHIRPS)
Produits utilisés : rainfall_chirps_monthly, rainfall_chirps_daily
Mots-clés : datasets; CHIRPS, climat, précipitations, mensuel
Aperçu
Ce bloc-notes montre comment accéder et utiliser les données mensuelles sur les précipitations infrarouges avec station (CHIRPS) du DE Africa Open Data Cube.
Pour obtenir des informations officielles sur cet ensemble de données, voir CHIRPS. Le résumé de cette documentation est copié ci-dessous :
Estimating rainfall variations in space and time is a key aspect of drought early warning and environmental monitoring. An evolving drier-than-normal season must be placed in a historical context so that the severity of rainfall deficits can be quickly evaluated. However, estimates derived from satellite data provide areal averages that suffer from biases due to complex terrain, which often underestimate the intensity of extreme precipitation events. Conversely, precipitation grids produced from station data suffer in more rural regions where there are less rain-gauge stations. CHIRPS was created in collaboration with scientists at the USGS Earth Resources Observation and Science (EROS) Center in order to deliver complete, reliable, up-to-date data sets for a number of early warning objectives, like trend analysis and seasonal drought monitoring.
Les jeux de données CHIRPS actuels accessibles depuis les plateformes de DE Africa sont le jeu de données « CHIRPS-2.0 Africa Monthly », copié ici <https://data.chc.ucsb.edu/products/CHIRPS-2.0/africa_monthly/tifs/>`__ et le jeu de données « CHIRPS-2.0 Africa Daily », copié ici <https://data.chc.ucsb.edu/products/CHIRPS-2.0/africa_daily/tifs/>`__. Ils ont été convertis en géotiffs optimisés pour le cloud et indexés dans l’Open-Data-Cube de DE Africa.
Spécifications importantes :
Nom du produit Datacube : « rainfall_chirps_monthly »
Type de mesure : Précipitations atmosphériques mensuelles
Unités de précipitations : Total mm/mois
Plage de dates : « 1981-01 » à aujourd’hui
Résolution spatiale : 0,05 degré, environ 5,55 km
Nom du produit Datacube : « rainfall_chirps_daily »
Type de mesure : Précipitations atmosphériques mensuelles
Unités de précipitations : Total mm/jour
Plage de dates : « 1981-01 » à aujourd’hui
Résolution spatiale : 0,05 degré, environ 5,55 km
Description
Dans ce notebook, nous allons charger les données CHIRPS en utilisant dc.load() pour renvoyer une série chronologique d’ensembles de données.
Les sujets abordés comprennent :
Inspection du produit mensuel CHIRPS et des mesures disponibles dans le datacube
Utilisation de la fonction native « dc.load() » pour charger les données CHIRPS
Tracé à facettes des ensembles de données CHIRPS
Réaliser un flux de travail d’analyse simple : trouver la moyenne mensuelle des précipitations à long terme
Commencer
Pour exécuter cette analyse, exécutez toutes les cellules du bloc-notes, en commençant par la cellule « Charger les packages ».
Charger des paquets
Importez les packages Python utilisés pour l’analyse.
[1]:
%matplotlib inline

import datacube
import numpy as np
from matplotlib import pyplot as plt
from deafrica_tools.plotting import display_map
Se connecter au datacube
[2]:
dc = datacube.Datacube(app="rainfall_chirps")
Paramètres d’analyse
Cette section définit les paramètres d’analyse, y compris
« lat, lon, buffer » : latitude/longitude centrales et taille de la fenêtre d’analyse pour la zone d’intérêt
time_period: période de temps à étudieroutput_crs: projection pour le chargement des données ; la résolution de sortie n’est pas définie, donc des résolutions différentes peuvent être utilisées pour Landsat et Sentinel-2
L’emplacement par défaut couvre tout le Nigéria
[3]:
lat, lon =  9.4707, 8.3899

buffer_lat, buffer_lon = 6, 6

time_period = ('2020')

output_crs = 'epsg:6933'

#join lat,lon,buffer to get bounding box
lon_range = (lon - buffer_lon, lon + buffer_lon)
lat_range = (lat + buffer_lat, lat - buffer_lat)
Afficher l’emplacement sélectionné
La cellule suivante affichera la zone sélectionnée sur une carte interactive. N’hésitez pas à zoomer et dézoomer pour mieux comprendre la zone que vous allez analyser. En cliquant sur n’importe quel point de la carte, vous découvrirez les coordonnées de latitude et de longitude de ce point.
[4]:
display_map(lon_range, lat_range)
[4]:
Produits et mesures disponibles
Liste des produits
Nous pouvons utiliser la fonctionnalité « list_products » de Datacube pour inspecter les ensembles de données de précipitations CHIRPS disponibles dans le Datacube. Le tableau ci-dessous indique les noms des produits que nous utiliserons pour charger les données et une brève description des données
[5]:
dc.list_products().loc[dc.list_products()['name'].str.contains('chirps')]
[5]:
| name | description | license | default_crs | default_resolution | |
|---|---|---|---|---|---|
| name | |||||
| rainfall_chirps_daily | rainfall_chirps_daily | Rainfall Estimates from Rain Gauge and Satelli... | None | None | None |
| rainfall_chirps_monthly | rainfall_chirps_monthly | Rainfall Estimates from Rain Gauge and Satelli... | None | None | None |
Liste des mesures
Nous pouvons examiner plus en détail les données disponibles pour CHIRPS à l’aide de la fonctionnalité « list_measurements » de Datacube. Le tableau ci-dessous répertorie chacune des mesures disponibles dans les données.
[6]:
measurements = dc.list_measurements()
measurements.loc["rainfall_chirps_monthly"]
[6]:
| name | dtype | units | nodata | aliases | flags_definition | |
|---|---|---|---|---|---|---|
| measurement | ||||||
| rainfall | rainfall | float32 | mm | -9999.0 | NaN | NaN |
Charger les données CHIRPS à l’aide de dc.load()
Maintenant que nous savons quels produits et mesures sont disponibles pour les produits, nous pouvons charger des données à partir du datacube en utilisant « dc.load ».
Dans le premier exemple ci-dessous, nous allons charger les données CHIRPS pour la région couvrant le Nigéria
Remarque : pour une discussion plus générale sur la manière de charger des données à l’aide du datacube, reportez-vous au bloc-notes « Introduction au chargement des données <../Beginners_guide/03_Loading_data.ipynb> ».
[7]:
ds_rf_month = dc.load(product='rainfall_chirps_monthly',
                time='2020',
                y = lat_range,
                x = lon_range,
                resolution=(-5000, 5000),
                output_crs=output_crs)

print(ds_rf_month)
<xarray.Dataset>
Dimensions:      (time: 12, y: 303, x: 232)
Coordinates:
  * time         (time) datetime64[ns] 2020-01-16T11:59:59.500000 ... 2020-12...
  * y            (y) float64 1.952e+06 1.948e+06 ... 4.475e+05 4.425e+05
  * x            (x) float64 2.325e+05 2.375e+05 ... 1.382e+06 1.388e+06
    spatial_ref  int32 6933
Data variables:
    rainfall     (time, y, x) float32 0.0 0.0 0.0 0.0 ... 79.19 76.53 79.77
Attributes:
    crs:           EPSG:6933
    grid_mapping:  spatial_ref
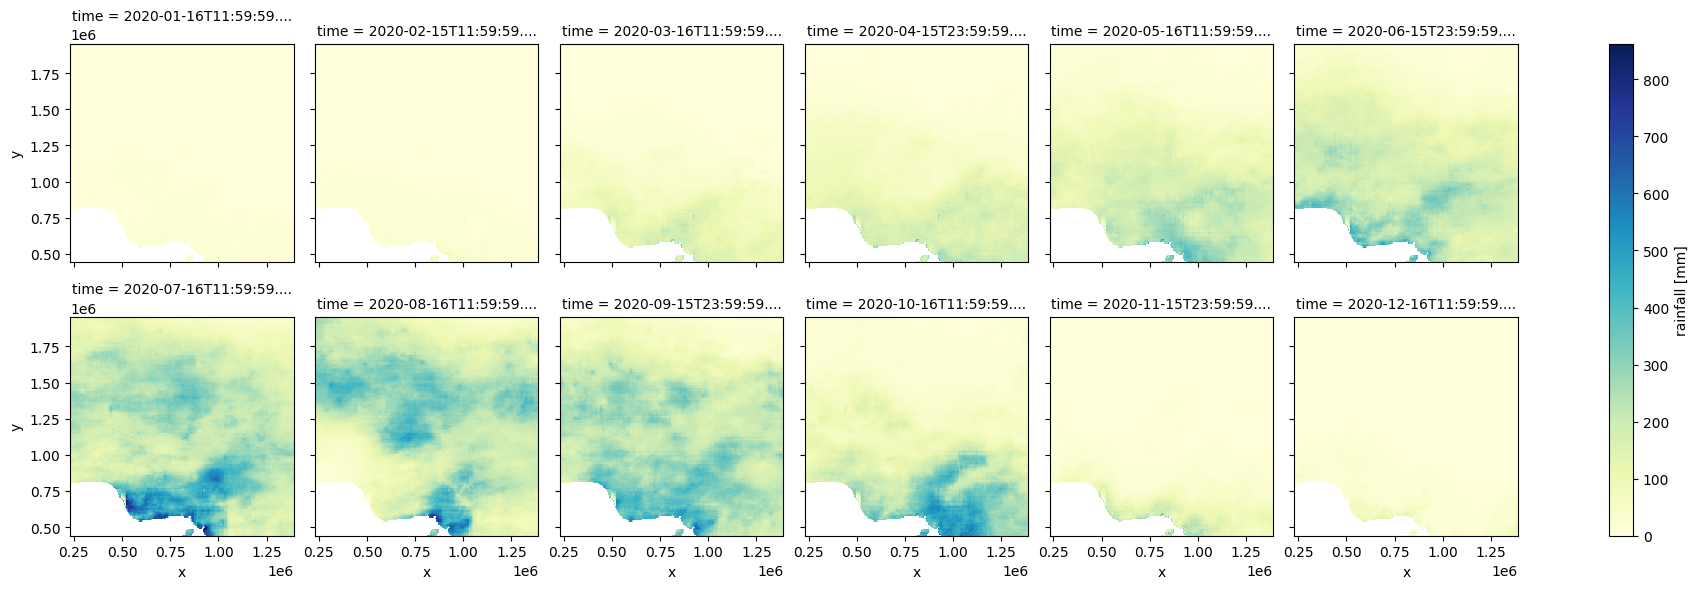
Représentation graphique des précipitations mensuelles CHIRPS
Traçons un graphique à facettes de la série chronologique pour voir les précipitations totales chaque mois en 2020 au Nigéria.
[8]:
# set -9999 no-data values to NaN
ds_rf_month = ds_rf_month.where(ds_rf_month !=-9999.)

#facet plot rainfall
ds_rf_month['rainfall'].plot.imshow(col='time', col_wrap=6, cmap='YlGnBu', label=False);
Chargement et traçage des précipitations quotidiennes
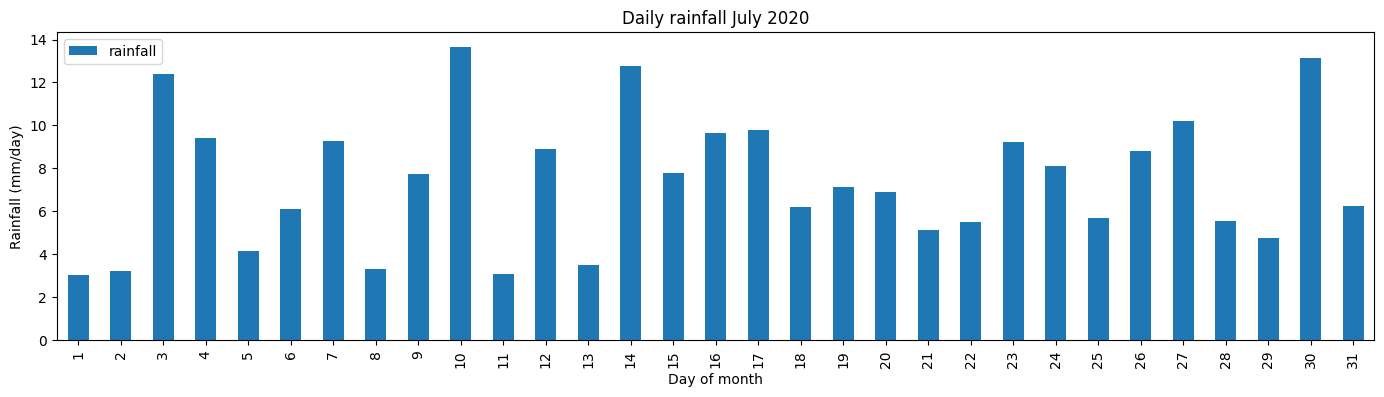
Dans le graphique ci-dessus, nous pouvons voir que beaucoup de pluie est tombée en juillet 2020. Nous allons charger les données de précipitations quotidiennes pour ce mois, les agréger sur l’ensemble de la région et tracer les totaux quotidiens pour voir comment ces précipitations ont été réparties au cours du mois.
[9]:
ds_rf_daily = dc.load(product='rainfall_chirps_daily',
                time='2020-07',
                y = lat_range,
                x = lon_range,
                resolution=(-5000, 5000),
                output_crs=output_crs)

print(ds_rf_daily)
<xarray.Dataset>
Dimensions:      (time: 31, y: 303, x: 232)
Coordinates:
  * time         (time) datetime64[ns] 2020-07-01T11:59:59.500000 ... 2020-07...
  * y            (y) float64 1.952e+06 1.948e+06 ... 4.475e+05 4.425e+05
  * x            (x) float64 2.325e+05 2.375e+05 ... 1.382e+06 1.388e+06
    spatial_ref  int32 6933
Data variables:
    rainfall     (time, y, x) float32 0.0 0.0 0.0 0.0 0.0 ... 0.0 0.0 0.0 0.0
Attributes:
    crs:           EPSG:6933
    grid_mapping:  spatial_ref
[10]:
# set -9999 no-data values to NaN
ds_rf_daily = ds_rf_daily.where(ds_rf_daily !=-9999.)

#find the mean
ds_rf_daily_mean = ds_rf_daily.mean(['x', 'y']).drop('spatial_ref').to_dataframe()
[11]:
ds_rf_daily_mean.plot.bar(figsize=(17,4))
plt.title('Daily rainfall July 2020')
plt.ylabel('Rainfall (mm/day)')
plt.xlabel('Day of month')
plt.xticks(np.arange(0,31,1), np.arange(1,32,1));
Exemple d’application : trouver la moyenne mensuelle des précipitations sur une région
La section suivante présente un flux de travail d’analyse simple basé sur les précipitations CHIRPS. Nous utiliserons une série chronologique de précipitations sur 10 ans au Nigéria pour trouver le total moyen mensuel des précipitations à long terme.
Nous allons d’abord charger les données, les paramètres ici sont les mêmes que dans l’exemple ci-dessus, sauf que nous avons augmenté la plage de temps d’un an à 10 ans.
[12]:
ds_rf = dc.load(
    product="rainfall_chirps_monthly",
    time=('2010', '2020'),
    y=lat_range,
    x=lon_range,
    resolution=(-5000, 5000),
    output_crs=output_crs,
)

print(ds_rf)
<xarray.Dataset>
Dimensions:      (time: 132, y: 303, x: 232)
Coordinates:
  * time         (time) datetime64[ns] 2010-01-16T11:59:59.500000 ... 2020-12...
  * y            (y) float64 1.952e+06 1.948e+06 ... 4.475e+05 4.425e+05
  * x            (x) float64 2.325e+05 2.375e+05 ... 1.382e+06 1.388e+06
    spatial_ref  int32 6933
Data variables:
    rainfall     (time, y, x) float32 0.0 0.0 0.0 0.0 ... 79.19 76.53 79.77
Attributes:
    crs:           EPSG:6933
    grid_mapping:  spatial_ref
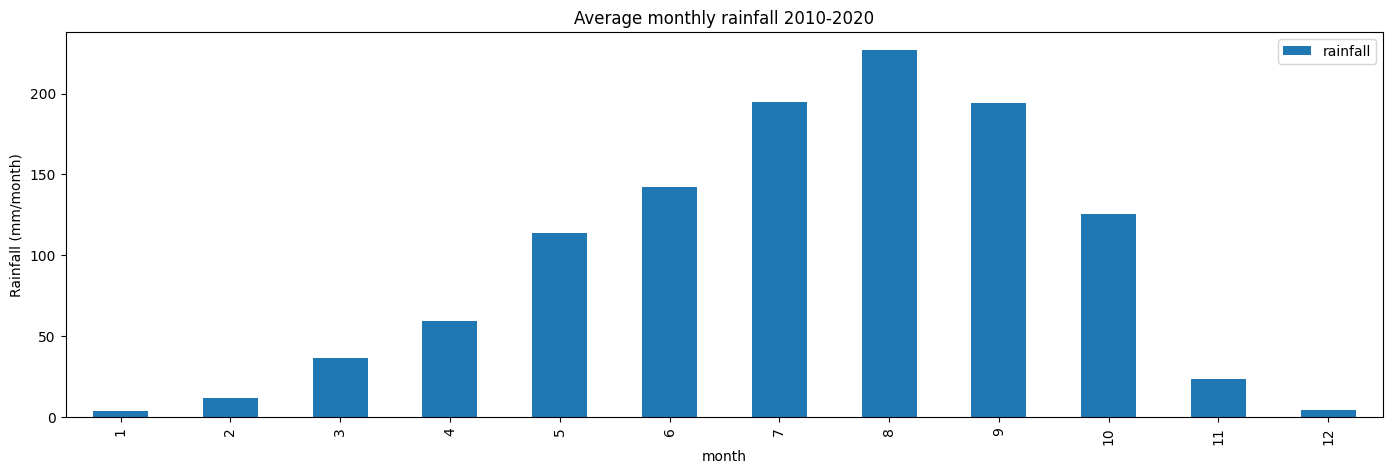
Trouvez la moyenne mensuelle des précipitations à long terme
Nous trouvons la moyenne des précipitations sur la région (ds_rf.mean(['x', 'y'])), puis nous regroupons tous les mêmes mois et trouvons la moyenne de tous les mois de janvier, février, etc. (groupby('time.month').mean()). Enfin, nous convertissons le résultat en un dataframe pandas (.drop('spatial_ref').to_dataframe()) pour faciliter le traçage d’un graphique à barres
[13]:
# set -9999 no-data values to NaN
ds_rf = ds_rf.where(ds_rf !=-9999.)

#find the mean
ds_rf_mean = ds_rf.mean(['x', 'y']).groupby('time.month').mean().drop('spatial_ref').to_dataframe()
ds_rf_mean.head()
[13]:
| rainfall | |
|---|---|
| month | |
| 1 | 3.673821 |
| 2 | 11.921728 |
| 3 | 36.385017 |
| 4 | 59.494869 |
| 5 | 113.811226 |
Tracer le résultat
[14]:
ds_rf_mean.plot.bar(figsize=(17,5))
plt.title('Average monthly rainfall 2010-2020')
plt.ylabel('Rainfall (mm/month)');
Informations Complémentaires
Licence : Le code de ce carnet est sous licence Apache, version 2.0 <https://www.apache.org/licenses/LICENSE-2.0>. Les données de Digital Earth Africa sont sous licence Creative Commons par attribution 4.0 <https://creativecommons.org/licenses/by/4.0/>.
Contact : Si vous avez besoin d’aide, veuillez poster une question sur le canal Slack Open Data Cube <http://slack.opendatacube.org/>`__ ou sur le GIS Stack Exchange en utilisant la balise open-data-cube (vous pouvez consulter les questions posées précédemment ici). Si vous souhaitez signaler un problème avec ce bloc-notes, vous pouvez en déposer un sur Github.
Version de Datacube compatible :
[15]:
print(datacube.__version__)
1.8.15
Dernier test :
[16]:
from datetime import datetime
datetime.today().strftime('%Y-%m-%d')
[16]:
'2023-08-11'