Données climatiques quadrillées ERA5
Produits utilisés : ERA5
Cet ensemble de données est externe à la plateforme Digital Earth Africa.
Mots-clés : données utilisées ; ERA5, ensembles de données ; ERA5, climat, température, précipitations, vent
Aperçu
Ce bloc-notes montre comment accéder et utiliser le produit de réanalyse climatique mondial du Centre européen pour les prévisions météorologiques à moyen terme (ECMWF) appelé ERA5, issu du programme AWS Public Dataset <https://registry.opendata.aws/ecmwf-era5/> ou de Google Cloud Storage <https://cloud.google.com/storage/docs/public-datasets/era5>.
Ce service opérationnel de 5e génération utilise les meilleures données d’observation disponibles provenant de satellites et de stations in situ, qui sont assimilées et traitées à l’aide du système de prévision intégré du CEPMMT. L’ensemble de données fournit des paramètres météorologiques atmosphériques essentiels tels que la température de l’air, la pression et le vent à différentes altitudes, ainsi que des paramètres de surface comme les précipitations et des paramètres de la mer comme la température de surface de la mer et la hauteur des vagues. La résolution spatiale est de 0,25 degré (latitude et longitude), ce qui équivaut à environ 31 km. Les données sont disponibles de 1979 à aujourd’hui et sont mises à jour de manière opérationnelle.
Pour obtenir des informations officielles sur cet ensemble de données, consultez la « documentation des données ERA5 de l’ECMWF <https://confluence.ecmwf.int/display/CKB/ERA5%3A+data+documentation> ».
Actuellement, l’ensemble de données AWS ERA 5 est obsolète. L’ensemble de données ERA5 utilisé dans le bloc-notes provient de Google Cloud Storage et couvre les années 1959 à 2022.
Description
Nous recommandons l’utilisation des données ERA5 au format Zarr qui permet un accès natif au cloud sans avoir besoin de télécharger les données.
15 variables de surface ou de niveau unique sont accessibles à l’aide de la fonction wrapper load_era5().
Catégorie |
Variable |
Nom pour la requête |
|---|---|---|
Précipitation |
Total Precipitation |
total_precipitation |
Vent |
Composante éolienne en U de 10 mètres |
vent d’est à 10 mètres |
Composante du vent V de 10 mètres |
vent_du_nord_à_10_mètres |
|
Température |
Température à 2 mètres |
température_de_l’air_à_2_mètres |
Température de la surface de la mer |
température_de_surface_de_la_mer |
|
Pression atmosphérique |
Pression au niveau moyen de la mer |
pression_de_l’air_au_niveau_moyen_de_la_mer |
Pression superficielle |
pression_de_surface |
Ce notebook présente des exemples d’accès et de travail avec les variables suivantes :
Précipitations totales journalières
Températures minimales et maximales quotidiennes de l’air à 2 mètres de hauteur
Vitesse horaire du vent à 10 mètres de hauteur
Température maximale mensuelle de l’air à 2 mètres de hauteur pour le continent
Commencer
Pour exécuter cette analyse, exécutez toutes les cellules du bloc-notes, en commençant par la cellule « Charger les packages ».
Charger des paquets
Importez les packages Python utilisés pour l’analyse.
[1]:
%matplotlib inline
import fsspec
import datacube
from matplotlib import pyplot as plt
import numpy as np
import rasterio as rio
import xarray as xr

from deafrica_tools.load_era5 import load_era5
Paramètres d’analyse
Définissez l’emplacement et la période de temps qui vous intéressent. Pour un test initial, utilisez une période de quelques mois maximum pour limiter l’accès aux données.
« lat » et « lon » : la plage de latitude et de longitude de la zone d’intérêt.
time: la plage de temps pour laquelle vous souhaitez extraire des données. Les heures peuvent être fournies sous forme de chaînes d’année, de mois ou de date ou d’objets datetime.
[2]:
# Lake Turkana Wind Power Station, Kenya
lat = (2.45, 2.55)
lon = (36.75, 36.85)

# Define the time window
time = '2025-01', '2025-03'
Précipitations totales journalières
Les précipitations totales correspondent à l’accumulation d’eau liquide et gelée, comprenant la pluie et la neige, qui tombe à la surface de la Terre. Elles n’incluent pas le brouillard, la rosée ou les précipitations qui s’évaporent dans l’atmosphère avant d’atterrir à la surface de la Terre. Les unités de ce paramètre sont la profondeur en mètres d’équivalent en eau. Il s’agit de la profondeur que l’eau aurait si elle était répartie uniformément sur la grille. Il convient d’être prudent lors de la comparaison des paramètres du modèle avec les observations, car les observations sont souvent locales à un point particulier dans l’espace et le temps, plutôt que de représenter des moyennes sur une grille de modèle.
Dans cet exemple, les précipitations totales sont agrégées à intervalles quotidiens.
Notez que la grille spatiale de sortie est alignée sur les points de la grille d’entrée les plus proches.
[3]:
var = 'total_precipitation'

precip = load_era5(var, lat, lon, time).compute()
Opening ERA5 Zarr dataset...
Variable: total_precipitation
Mapped ERA5 name: total_precipitation
Time: 2025-01-01 to 2025-03-01
Latitude: 2.45 to 2.55
Longitude: 36.75 to 36.849999999999994
Selecting time range...
Normalising longitude coordinates...
Selecting AOI...
Subset size: {'time': 1440, 'latitude': 1, 'longitude': 1}
Resampling to 1D using mean...
ERA5 loading complete.
[4]:
# convert to Millimeters (mm), keeping other attributes
attrs = precip[var].attrs
attrs['units']='mm'
precip = precip*1000
precip[var].attrs = attrs
[5]:
# plot daily total precipitation for this area
precip[var].sum(['lat','lon']).plot(figsize = (16,4), marker='o', markersize=4, linewidth=0);
plt.xlabel('Day');
plt.ylabel('%s (%s)'%('Total Precipitation', precip[var].attrs['units']));

Températures minimales et maximales quotidiennes de l’air à 2 mètres de hauteur
L’estimation de la température de l’air est fournie en kelvin (K) et peut être convertie en degrés Celsius (°C) en soustrayant 273,15.
Dans cet exemple, les températures quotidiennes les plus élevées et les plus basses sont extraites.
Paramètres facultatifs utilisés pour charger les données :
reduce_func: fonction permettant d’agréger les données horaires d’entrée, définie sur np.max et np.min pour calculer la température maximale et minimale.« resample » : fréquence de rééchantillonnage temporel, « 1D » (par défaut) pour l’agrégation quotidienne.
Notez que la grille spatiale de sortie est alignée sur les points de la grille d’entrée les plus proches.
[6]:
temp_var = 'air_temperature_at_2_metres'

temp_max = load_era5(temp_var, lat, lon, time, reduce_func=np.max, resample='1D').compute()

temp_min = load_era5(temp_var, lat, lon, time, reduce_func=np.min, resample='1D').compute()
Opening ERA5 Zarr dataset...
Variable: air_temperature_at_2_metres
Mapped ERA5 name: 2m_temperature
Time: 2025-01-01 to 2025-03-01
Latitude: 2.45 to 2.55
Longitude: 36.75 to 36.849999999999994
Selecting time range...
Normalising longitude coordinates...
Selecting AOI...
Subset size: {'time': 1440, 'latitude': 1, 'longitude': 1}
Resampling to 1D using <function max at 0x7fb8a02027a0>...
ERA5 loading complete.
Opening ERA5 Zarr dataset...
Variable: air_temperature_at_2_metres
Mapped ERA5 name: 2m_temperature
Time: 2025-01-01 to 2025-03-01
Latitude: 2.45 to 2.55
Longitude: 36.75 to 36.849999999999994
Selecting time range...
Normalising longitude coordinates...
Selecting AOI...
Subset size: {'time': 1440, 'latitude': 1, 'longitude': 1}
Resampling to 1D using <function min at 0x7fb8a02028e0>...
ERA5 loading complete.
[7]:
# convert to Celsius, keeping other attributes
attrs = temp_max.attrs
attrs['units']='C'
temp_max, temp_min = temp_max-273.15, temp_min-273.15
temp_max[temp_var].attrs = attrs
temp_min[temp_var].attrs = attrs
[8]:
# plot mean temperatures for this area
temp_max[temp_var].mean(['lat','lon']).plot(figsize = (16,4), label='Highest');
temp_min[temp_var].mean(['lat','lon']).plot(label='Lowest');
plt.legend();
plt.xlabel('Day');
plt.ylabel('%s (%s)'%('Tempeature at 2 metres', temp_max[temp_var].attrs['units']));

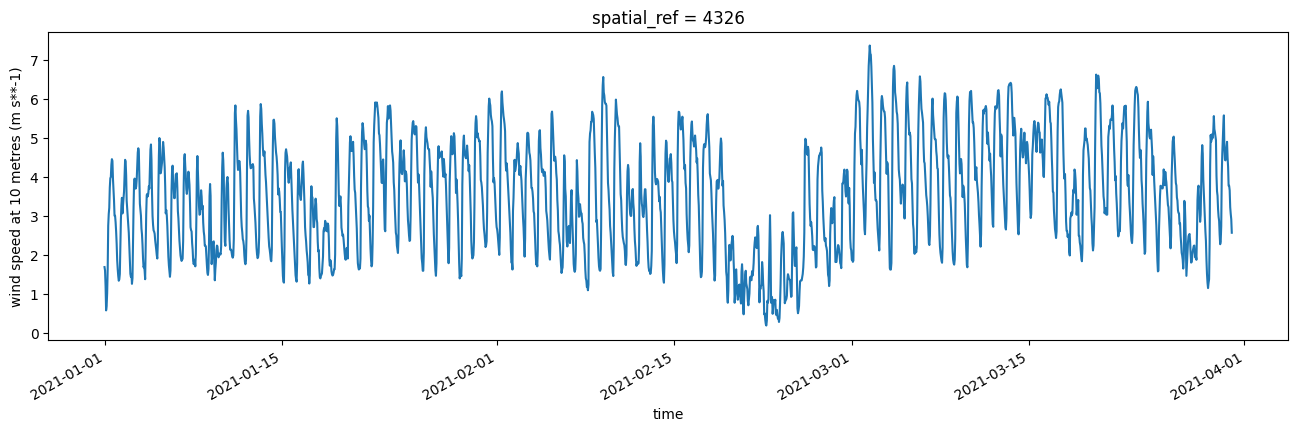
Vitesse horaire maximale du vent à 10 mètres de hauteur
Le vent provoque des changements dans les caractéristiques de surface de certains types de couverture terrestre, par exemple la rugosité de la surface de l’eau. Une rugosité de surface accrue entraîne une augmentation de la rétrodiffusion radar mesurée. Bien qu’il soit généralement plus fort que le vent à la surface, le vent à 10 mètres de hauteur peut être utilisé pour signaler des conditions venteuses.
Dans ERA5, l’estimation du vent horizontal est fournie en mètres par seconde et est représentée par une composante est et une composante nord. Un signe négatif indique que l’air se déplace dans la direction opposée, par exemple vers l’ouest pour la composante est. Les deux composantes peuvent être combinées pour donner la vitesse et la direction du vent horizontal.
La vitesse du vent est très variable tout au long de la journée, l’échantillonnage est donc effectué toutes les heures.
Paramètres facultatifs utilisés pour charger les données :
« resample » : fréquence de rééchantillonnage temporel, « 1 h », de sorte que les données de sortie soient à la même fréquence que l’entrée.
Notez que la grille spatiale de sortie est alignée sur les points de la grille d’entrée les plus proches.
[9]:
east = "eastward_wind_at_10_metres"
north = "northward_wind_at_10_metres"

wind_east = load_era5(east, lat, lon, time, resample='6h').compute()

wind_north = load_era5(north, lat, lon, time, resample='6h').compute()
Opening ERA5 Zarr dataset...
Variable: eastward_wind_at_10_metres
Mapped ERA5 name: 10m_u_component_of_wind
Time: 2025-01-01 to 2025-03-01
Latitude: 2.45 to 2.55
Longitude: 36.75 to 36.849999999999994
Selecting time range...
Normalising longitude coordinates...
Selecting AOI...
Subset size: {'time': 1440, 'latitude': 1, 'longitude': 1}
Resampling to 6h using mean...
ERA5 loading complete.
Opening ERA5 Zarr dataset...
Variable: northward_wind_at_10_metres
Mapped ERA5 name: 10m_v_component_of_wind
Time: 2025-01-01 to 2025-03-01
Latitude: 2.45 to 2.55
Longitude: 36.75 to 36.849999999999994
Selecting time range...
Normalising longitude coordinates...
Selecting AOI...
Subset size: {'time': 1440, 'latitude': 1, 'longitude': 1}
Resampling to 6h using mean...
ERA5 loading complete.
Combinez les deux composantes du vent pour obtenir la vitesse du vent
L’amplitude de la vitesse du vent est calculée à partir des composants U et V comme suit \(sqrt(U^2 + V^2)\).
[10]:
wind = (wind_east[east]**2 + wind_north[north]**2)**0.5
wind.attrs['units'] = wind_east[east].attrs['units']
[11]:
# plot mean wind speed for this area
wind.mean(['lat','lon']).plot(figsize = (16,4));
plt.ylabel('%s (%s)'%('wind speed at 10 metres', wind.attrs['units']));

Température maximale mensuelle de l’air à 2 mètres de hauteur
Dans cet exemple, la température maximale de l’air à 2 mètres de hauteur est récupérée mensuellement pour le continent africain.
Les plages de latitude et de longitude sont définies pour couvrir le continent. La plage horaire est définie de janvier à mars 2021.
Paramètres facultatifs utilisés pour charger les données :
reduce_func: fonction permettant d’agréger les données horaires d’entrée, définie sur np.max pour calculer la température maximale.
[12]:
temp_var = 'air_temperature_at_2_metres'

temp_max_month = load_era5(temp_var, (-40, 40), (-20, 60), ('2021-01', '2021-03'), reduce_func=np.max, resample='1M').compute()

# convert to Celsius, keeping other attributes
attrs = temp_max_month.attrs
attrs['units']='C'
temp_max_month = temp_max_month-273.15
temp_max_month[temp_var].attrs = attrs
Opening ERA5 Zarr dataset...
Variable: air_temperature_at_2_metres
Mapped ERA5 name: 2m_temperature
Time: 2021-01-01 to 2021-03-01
Latitude: -40 to 40
Longitude: -20 to 60
Selecting time range...
Normalising longitude coordinates...
Selecting AOI...
Subset size: {'time': 1440, 'latitude': 321, 'longitude': 321}
Resampling to 1M using <function max at 0x7fb8a02027a0>...
ERA5 loading complete.
/opt/venv/lib/python3.12/site-packages/xarray/groupers.py:530: FutureWarning: 'M' is deprecated and will be removed in a future version, please use 'ME' instead.
  self.index_grouper = pd.Grouper(
[13]:
# plot for each month
temp_max_month[temp_var].plot(col='time', col_wrap=3, vmin=-20, vmax=50, cmap = 'coolwarm', figsize=(16, 5));
Informations Complémentaires
Licence : Le code de ce carnet est sous licence Apache, version 2.0 <https://www.apache.org/licenses/LICENSE-2.0>. Les données de Digital Earth Africa sont sous licence Creative Commons par attribution 4.0 <https://creativecommons.org/licenses/by/4.0/>.
Contact : Si vous avez besoin d’aide, veuillez poster une question sur le canal Slack Open Data Cube <http://slack.opendatacube.org/>`__ ou sur le GIS Stack Exchange en utilisant la balise open-data-cube (vous pouvez consulter les questions posées précédemment ici). Si vous souhaitez signaler un problème avec ce bloc-notes, vous pouvez en déposer un sur Github.
Version de Datacube compatible :
[14]:
print(datacube.__version__)
1.9.13
Dernier test :
[15]:
from datetime import datetime
datetime.today().strftime('%Y-%m-%d')
[15]:
'2026-04-29'