Surveillance des côtes
Date modified: June 2025
Présentation du service
Aperçu
The Digital Earth Africa Coastlines is a continental dataset that includes annual shorelines and rates of coastal change along the entire African coastline. This is a provisional service that has been generated for 2000 onwards and we would like to improve and operationalize with users.
Le produit combine les données satellite du programme Digital Earth Africa avec la modélisation des marées pour cartographier l’emplacement typique du littoral au niveau moyen de la mer chaque année. Le produit permet d’examiner chaque année les tendances de l’érosion et de la croissance côtières à l’échelle locale et continentale, et de cartographier les modèles de changement côtier de manière historique et de les mettre à jour régulièrement à mesure que les données continuent d’être acquises. Cela permet de comparer les taux actuels de changement côtier à ceux observés au cours des années ou des décennies précédentes.
La capacité de cartographier les positions du littoral pour chaque année fournit des informations précieuses sur la question de savoir si les changements du littoral sont le résultat d’événements ou d’actions particuliers, ou d’un processus de changement plus progressif au fil du temps. Ces informations peuvent permettre aux scientifiques, aux gestionnaires et aux décideurs politiques d’évaluer l’impact de l’ensemble des facteurs qui affectent le littoral et éventuellement d’aider à la planification et à la prévision des scénarios futurs.
Spécifications
Plusieurs ensembles de données sont disponibles dans le cadre de la suite Coastlines.
Un Jupyter Notebook qui démontre le chargement et l’utilisation des produits Coastlines dans le Sandbox est également disponible.
Tableau 1 : Ensembles de données du produit Littoraux
Type de produit |
Nom du produit |
Type de données |
|---|---|---|
Littoraux annuels |
|
Vecteur - ligne |
Statistiques sur le taux de variation |
|
Vecteur - point |
Points chauds de changement côtier zoom 1 (15 km) |
|
Vecteur - point |
Points chauds de changement côtier zoom 2 (5 km) |
|
Vecteur - point |
Points chauds de changement côtier zoom 3 (1 km) |
|
Vecteur - point |
Tableau 2 : Étendue des côtes de Digital Earth Africa
Spécification |
|
|---|---|
Nom du produit |
Littoraux de l’Afrique de l’Ouest |
Taille de la cellule - X (mètres) |
30 |
Taille de la cellule - Y (mètres) |
30 |
Système de référence de coordonnées |
ESPG:6933 |
Résolution temporelle |
Annuel |
Plage temporelle |
2000 - previous year |
Ensemble de données parent |
Réflectance de surface de la collection Landsat 2 |
Fréquence de mise à jour |
Annuel |
Latence de mise à jour |
6 mois à compter de la fin de l’année précédente |
Figure 1 : Étendue géographique de la suite des côtes de l’Afrique de l’Ouest
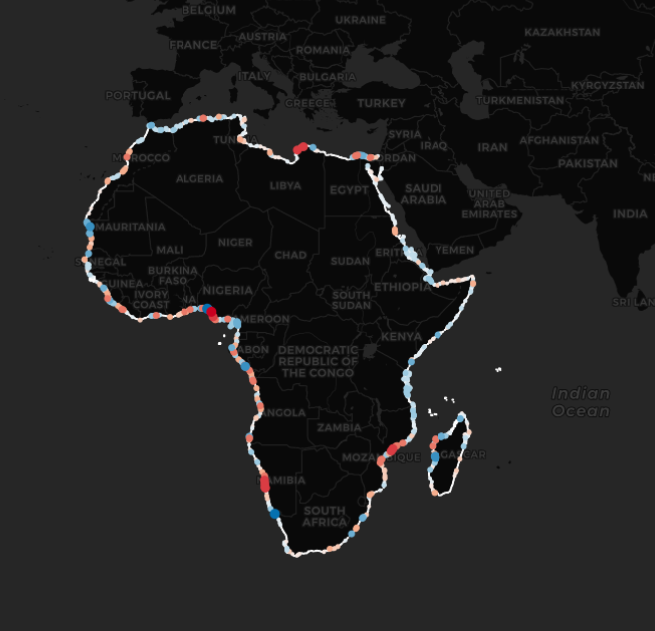
Digital Earth Africa Coastlines est un ensemble de données continentales qui comprend le taux de points chauds de changement côtier, les points chauds rouges représentant le recul côtier et les points chauds bleus représentant la croissance côtière.
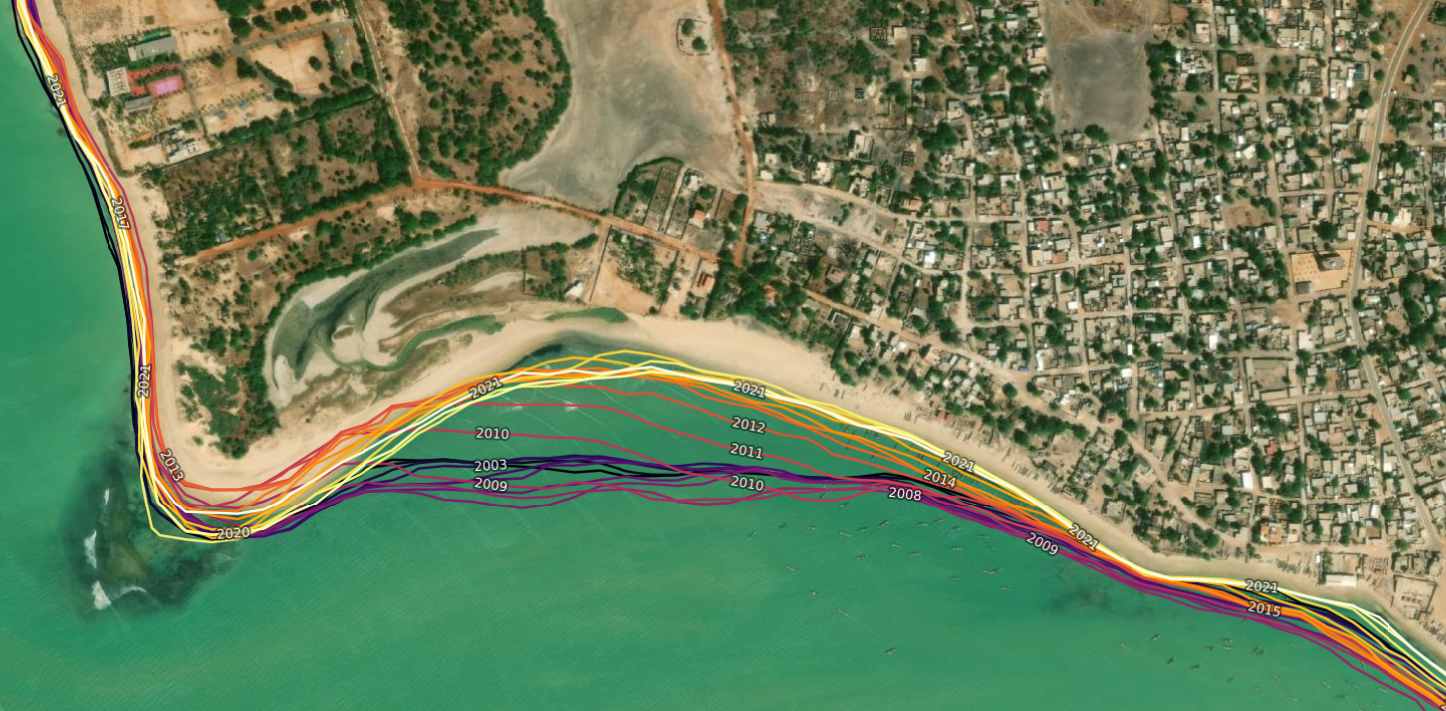
Littoraux annuels Littoraux
Vecteurs annuels du littoral de 2000 qui représentent la position médiane ou « la plus représentative » du littoral à environ la marée moyenne du niveau de la mer (0 m au-dessus du niveau moyen de la mer) pour chaque année.
Les lignes de couleur claire (par exemple jaune) sur le graphique représentent les rivages récents (par exemple 2020), tandis que les lignes de couleur foncée représentent les rivages plus anciens (par exemple 2000).
Les rivages en pointillés présentent une faible certitude en raison soit d’un nombre limité d’observations satellites non nuageuses, soit de données instables causées par de mauvaises performances de modélisation des marées ou une forte variabilité côtière, soit de problèmes d’aérosols.
Figure 2 : Littoraux annuels de l’Afrique de l’Est. Littoraux visualisés sur la carte Web interactive de l’Afrique de l’Est
Attribut de certitude
Données instables : La qualité de ce littoral est affectée par des données instables (écart type MNDWI élevé). Cela peut être dû à des erreurs dans le modèle de marée utilisé pour réduire l’influence de la marée, à la présence de vasières intertidales ou de bancs de sable en pente douce qui peuvent conduire à une cartographie inexacte du littoral ou à des images satellite bruyantes causées par des niveaux élevés de nébulosité.
Données insuffisantes : La qualité des littoraux peut être affectée par des observations satellitaires limitées et de bonne qualité (moins de cinq observations claires après comblement des lacunes). Cela peut conduire à des littoraux plus bruyants et moins fiables.
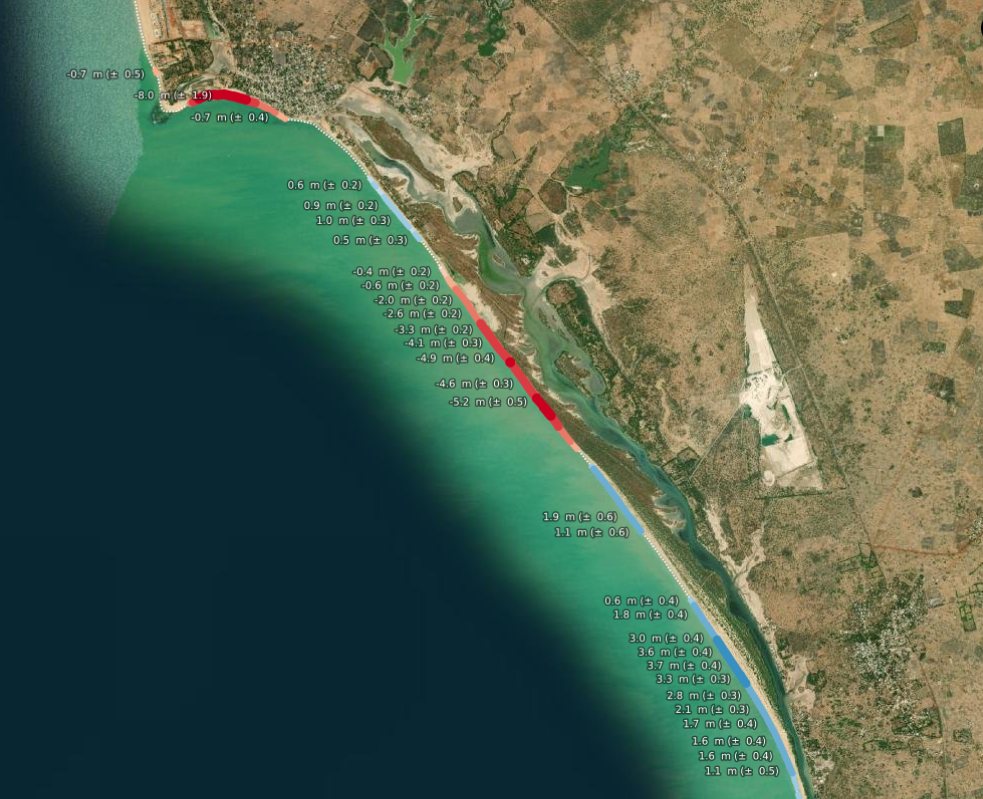
Statistiques sur le taux de changement
Un ensemble de données ponctuelles fournissant des taux fiables de changement côtier (en mètres par an) pour chaque 30 m le long des côtes non rocheuses (par exemple sablonneuses et boueuses) d’Afrique. Ces taux sont calculés en régressant linéairement les positions annuelles du littoral en fonction du temps, en utilisant le littoral le plus récent comme base de référence.
Les valeurs négatives (points rouges) indiquent un recul (par exemple, l’érosion) et les valeurs positives indiquent une croissance (par exemple, la progradation) au fil du temps. Par défaut, les taux de changement sont affichés pour les points présentant une tendance statistiquement significative au fil du temps uniquement.
Tableau 3 : Descriptions des attributs des statistiques sur le taux de changement
Attribut |
|
|---|---|
taux_de_durée |
Taux de variation annuels (en mètres par an) calculés en effectuant une régression linéaire des distances annuelles du littoral en fonction du temps (à l’exclusion des valeurs aberrantes). Les valeurs négatives indiquent un recul et les valeurs positives une croissance. |
sig_time |
Signification (valeur p) de la relation linéaire entre les distances annuelles du littoral et le temps. De faibles valeurs (par exemple, une valeur p < 0,01) peuvent indiquer qu’un littoral subit des changements côtiers constants au fil du temps. |
se_time |
Erreur standard (en mètres) de la relation linéaire entre les distances annuelles du littoral et le temps. Cela peut être utilisé pour générer des intervalles de confiance autour du taux de changement donné par rate_time (par exemple, intervalle de confiance à 95 % = se_time * 1,96). |
heure_de_sortie |
Les valeurs annuelles individuelles du trait de côte sont des estimateurs bruyants de la position du trait de côte qui peuvent être influencés par les conditions environnementales (par exemple, nuages, vagues déferlantes, embruns) ou par des problèmes de modélisation (par exemple, de mauvais résultats de modélisation des marées ou des observations satellites claires limitées). Pour obtenir des taux de changement fiables, les valeurs aberrantes du trait de côte sont exclues à l’aide d’un algorithme robuste de détection des valeurs aberrantes de l’écart absolu médian, et enregistrées dans cette colonne. |
sce |
Enveloppe de changement du littoral (SCE). Mesure du changement ou de la variabilité maximale sur l’ensemble des littoraux annuels, calculée en calculant la distance maximale entre deux littoraux annuels (à l’exclusion des valeurs aberrantes). Cette statistique exclut la variabilité infra-annuelle du littoral. |
nsm |
Mouvement net du littoral (MSL). Distance entre le littoral annuel le plus ancien (2000) et le plus récent (à l’exclusion des valeurs aberrantes). Les valeurs négatives indiquent que le littoral a reculé entre le littoral le plus ancien et le plus récent ; les valeurs positives indiquent une croissance. Cette statistique ne reflète pas la variabilité subannuelle du littoral, elle sous-estime donc l’étendue totale de la variabilité à un endroit donné. |
année_max, année_min |
Année au cours de laquelle les littoraux annuels ont atteint respectivement leur maximum (c’est-à-dire situés le plus loin vers l’océan) et leur minimum (c’est-à-dire situés le plus loin vers l’intérieur des terres) (à l’exclusion des valeurs aberrantes). Cette statistique exclut la variabilité infra-annuelle du littoral. |
heure_de_sortie |
Les valeurs annuelles individuelles du trait de côte sont des estimateurs bruyants de la position du trait de côte qui peuvent être influencés par les conditions environnementales (par exemple, nuages, vagues déferlantes, embruns) ou par des problèmes de modélisation (par exemple, de mauvais résultats de modélisation des marées ou des observations satellites claires limitées). Pour obtenir des taux de changement fiables, les valeurs aberrantes du trait de côte sont exclues à l’aide d’un algorithme robuste de détection des valeurs aberrantes de l’écart absolu médian, et enregistrées dans cette colonne. |
Figure 3 : Statistiques sur le taux de changement des côtes de l’Afrique de l’Est visualisées sur la carte Web interactive de l’Afrique de l’Est
Attribut de certitude
Îles au large : points situés dans des nations insulaires au large où les données sur les côtes sont affectées par des niveaux de bruit élevés, potentiellement liés à des problèmes d’aérosols dans les données d’entrée Landsat Collection 2 ARD.
Côte probablement rocheuse : les taux de changement peuvent être peu fiables dans les zones avec des rivages rocheux/rocheux escarpés en raison de l’ombre du terrain.
Valeur extrême (> 200 m) : les valeurs extrêmes du taux de changement (changement > 200 m par an) sont plus susceptibles de refléter des problèmes de modélisation que des changements côtiers réels.
Forte variabilité angulaire : les rivages annuels à cet endroit ne se situent pas sur une ligne approximative, ce qui rend les taux de changement invalides.
Observations insuffisantes : Moins de 15 rivages annuels valides à cet endroit, ce qui rend les taux de changement résultants plus susceptibles d’être inexacts.
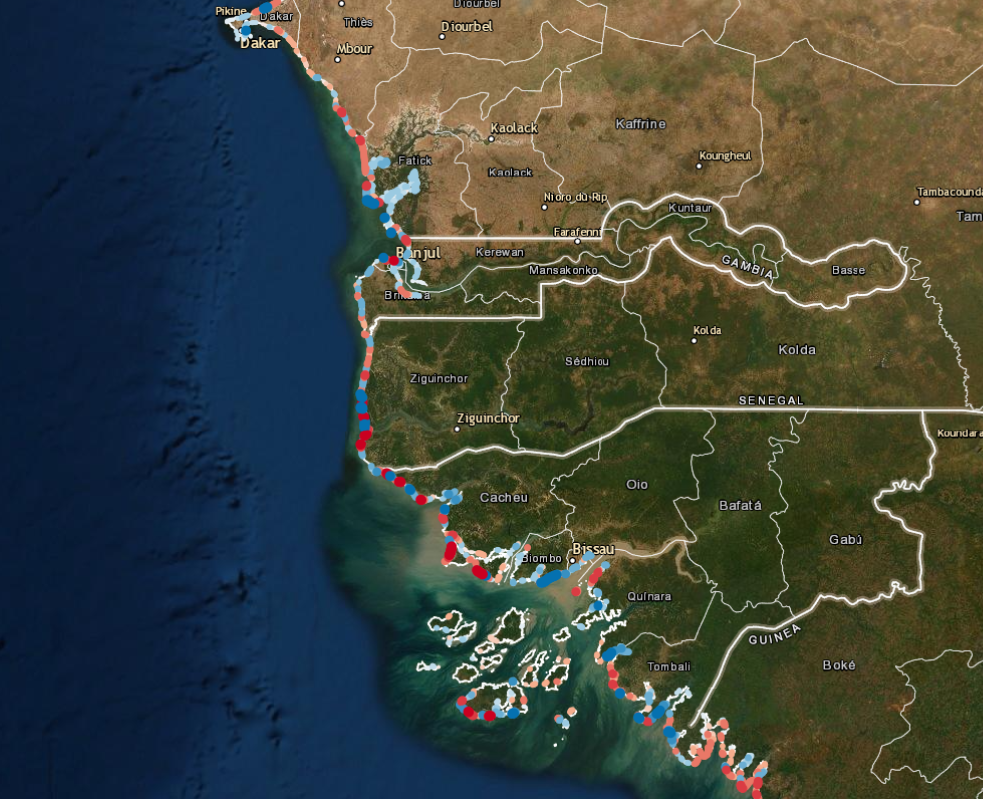
Points chauds du changement côtier
Une couche récapitulative produisant des points chauds de fenêtre mobile sur les changements côtiers à trois échelles différentes, dont 15 km, 5 km et 1 km. Elle est utile pour visualiser les schémas de changement côtier à l’échelle régionale ou continentale.
Figure 4 : Points chauds de changement côtier des côtes de l’Afrique de l’Est visualisées sur la carte Web interactive de l’Afrique de l’Est
Attribut de certitude
Points insuffisants : Taux de changement insuffisants à cet endroit pour produire des points chauds fiables.
Traitement
Le produit Coastlines est généré en appliquant la méthode décrite dans Bishop-Taylor et al. (2021) aux données de réflectance de surface de la collection Landsat 2.
Les scripts utilisés pour produire les côtes sont disponibles dans le référentiel github deafrica-coastlines <https://github.com/digitalearthafrica/deafrica-coastlines>`__.
Médias et exemples d’images
Services connexes
Références
Bishop-Taylor, R., Nanson, R., Sagar, S., Lymburner, L. (2021). Cartographie du littoral dynamique de l’Australie au niveau moyen de la mer à l’aide de trois décennies d’images Landsat. Télédétection de l’environnement, 267, 112734. Disponible : https://doi.org/10.1016/j.rse.2021.112734
Bishop-Taylor, R., Sagar, S., Lymburner, L., Alam, I., Sixsmith, J. (2019). Extraction de la ligne de flottaison sous-pixel : caractérisation de la précision et de la sensibilité aux indices et aux spectres. Télédétection, 11 (24) : 2984. Disponible : https://doi.org/10.3390/rs11242984
Licence
Licence internationale CC BY Attribution 4.0
Remerciements
Les algorithmes Coastlines intégrés dans ce produit sont le travail de Robbi-Bishop Taylor, Rachel Nanson, Stephen Sagar et Leo Lymburner, Geoscience Australia. Digital Earth Africa reconnaît le travail effectué par le Centre de Suivi Ecologique (CSE), Dakar, pour évaluer l’exactitude du service avec la participation des parties prenantes de la WACA d’Afrique de l’Ouest. Des remerciements vont également au Centre régional de ressources cartographiques pour le développement (RCMRD) pour l’engagement et les commentaires des parties prenantes. Digital Earth Africa remercie l’équipe de développement de produits de Digital Earth Africa pour la co-conception, le co-développement et les premiers retours sur le service.
Accès aux données
Amazon Web Service S3
Les données Digital Earth Africa Coastlines sont accessibles à partir du bucket S3 associé.
Tableau 4 : Détails de l’accès aux données AWS
Détails AWS S3 |
|
|---|---|
ARN du compartiment |
|
Noms de produits |
« littoraux » |
Région |
|
La dernière version du produit Coastlines peut être téléchargée à partir des liens ci-dessous :
Services Web OGC (OWS)
Ce produit est disponible via OWS de DE Africa.
Tableau 5 : Détails d’accès aux données OWS
Détails de l’OWS |
|
|---|---|
Nom |
« DE Africa Services » |
URL des services de cartographie Web (WMS) |
|
URL des services de fonctionnalités Web (WFS) |
|
Noms des calques |
|
Open Data Cube (ODC)
Le produit Coastlines peut être chargé et analysé dans le DE Africa Sandbox en suivant l’exemple Jupyter Notebook <https://github.com/digitalearthafrica/deafrica-sandbox-notebooks/blob/coastlines-notebook/Datasets/Coastlines.ipynb>`__.
Pour plus d’informations sur l’utilisation du produit DE Africa Coastlines, visitez le service d’assistance Digital Earth Africa <https://helpdesk.digitalearthafrica.org/portal/en/kb/search/coastlines>`__.
Informations techniques
Délimitation du littoral
Les littoraux sont cartographiés à l’aide d’observations satellites Landsat. Pour chaque observation, l’indice différentiel normalisé modifié de l’eau (MNDWI) est calculé à partir des bandes verte et infrarouge à ondes courtes (SWIR) pour identifier l’eau. La formule est la suivante
Lors de l’interprétation de cet indice, les valeurs supérieures à 0 indiquent de l’eau.
Précision et limites
Évaluation de la précision
Le Centre de Suivi Ecologique de Dakar a mené une étude pour tester la performance des Littoraux de l’Afrique de l’Ouest en collaboration avec les États membres du réseau WACA/ORLOA (Projet d’Investissement pour la Résilience des Zones Côtières de l’Afrique de l’Ouest / Observatoire Régional du Littoral de l’Afrique de l’Ouest) Mauritanie, Sénégal, Gambie, Guinée Bissau, République de Guinée, Sierra Leone, Libéria, Côte d’Ivoire, Ghana, Togo, Bénin et Sao Tomé et Principe. Dans chaque pays, des sites tests ont été sélectionnés en fonction de la taille de la portion de côte, de la disponibilité des données de référence et des métadonnées associées à chaque type de données. L’imagerie de chaque pays ayant une précision constante de 5 m.
Tableau 6 : Emplacements des tests de performance des côtes de l’Afrique de l’Est et métadonnées associées
Pays |
Type d’image |
Source |
Date d’acquisition |
Résolution (m) |
Bandes spectrales |
|---|---|---|---|---|---|
Mauritanie |
Constellation de WorldView |
Google Earth - Maxar |
2 avril 2021 |
<1 |
3 bandes RVB |
Sénégal |
Légion de la vision du monde |
Maxar Technologies |
8 juin 2021 |
0,5 |
4 bandes RGBN |
Gambie |
Constellation de WorldView |
Terre Google - Maxar |
9 janvier 2021 |
<1 |
3 bandes RVB |
Guinée Bissau |
Constellation de WorldView |
Google Earth - Maxar |
12 décembre 2018 |
<1 |
3 bandes RVB |
Guinée |
Constellation de WorldView |
Google Earth - Maxar |
Avril 2017 |
1 <1 |
3 bandes RVB |
Libéria |
Constellation de WorldView |
Google Earth - Maxar |
31 octobre 2021 |
<1 |
3 bandes RVB |
Sierra Leone |
Constellation de WorldView |
Google Earth - Maxar |
18 février 2018 |
<1 |
3 bandes RVB |
Côte d’Ivoire |
Constellation de WorldView |
Google Earth - Maxar |
12 janvier 2021 |
<1 |
3 bandes RVB |
Ghana |
Constellation de WorldView |
Google Earth - Maxar |
31 octobre 2018 |
<1 |
3 bandes RVB |
Aller |
Constellation de WorldView |
Google Earth - Maxar |
17 octobre 2019 |
<1 |
3 bandes RVB |
Bénin |
Constellation de WorldView |
Google Earth - Maxar |
31 juillet 2019 |
<1 |
3 bandes RVB |
Vue panoramique du monde-1 |
Maxar Technologies |
1er juin 2010 |
0,5 |
3 bandes RVB |
|
Sao Tomé-et-Principe |
Pléiades |
Airbus du CNES |
21 octobre 2019 |
<1 |
3 bandes RVB |
RVB = Rouge, Vert, Bleu ; BRGN = Rouge, Vert, Bleu, Proche Infrarouge
Des indicateurs de précision tels que l’erreur quadratique moyenne (RMSE), l’erreur absolue moyenne (MAE) et le coefficient de détermination (R^2) sont utilisés pour tester les performances de l’outil DE Africa dans l’extraction des côtes avec une bonne précision le long des transects.
- \[\text{RMSE} = \sqrt{\Sigma_{i=1}^{n}{\frac{\big({\hat{y}_i - y_i})^2}{n}}}\]
- \[R^2 = 1 - \frac{(\Sigma_{i=1}^{n}({y_i - \hat{y}_i})^2)}{(\Sigma_{i=1}^{n}({y_{(i -)} \overline{y}})^2)}\]
- \[\text{MAE} = \frac{1}{n}\Sigma_{(i=1)}^{n}|\hat{y}_i - y_i|\]
Figure 5 : Diagramme des points de transect le long du littoral
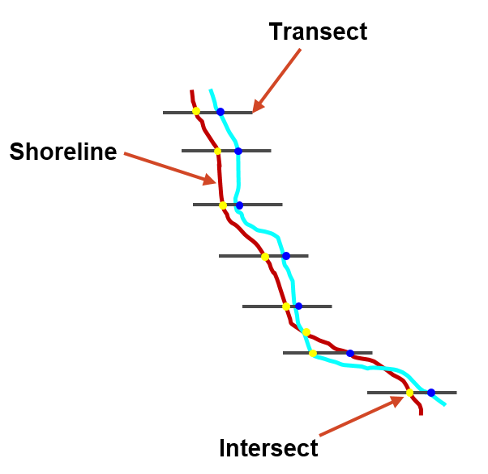
Suite à l’évaluation de la précision de l’outil DE Africa Coastlines, le suivi de la dynamique du trait de côte a été réalisé sur le site de Saly Portudal (Sénégal), comme étude de cas. Le RMSE moyen obtenu est d’environ 7,27 m. Les résultats obtenus sont de taille bien inférieure au pixel. Cette étude prouve la fiabilité et la pertinence de l’utilisation combinée de l’outil DE Africa Coastlines avec les images Landsat pour le suivi de l’érosion côtière.
Tableau 7 : Résultats de l’indicateur de précision du test de performance des côtes de l’Afrique de l’Ouest
Pays |
Min |
Max |
MAE |
RMSE |
RMSE (%) |
RMSE (Px) |
Précision |
|---|---|---|---|---|---|---|---|
Mauritanie |
0,00 |
31.29 |
7.17 |
8,79 |
29h30 |
2/5 |
Bien |
Sénégal |
0,36 |
10.17 |
4.51 |
5.42 |
18.07 |
1/5 |
Très bien |
Gambie |
0,00 |
22.32 |
5.26 |
7.77 |
25,90 |
2/5 |
Bien |
Guinée Bissau |
0,37 |
16h00 |
6.41 |
7.80 |
26,00 |
2/5 |
Bien |
Guinée |
0,25 |
24,81 |
8.14 |
9,75 |
32,50 |
2/5 |
Bien |
Libéria |
0,12 |
17h15 |
8.21 |
9.31 |
31.03 |
2/5 |
Bien |
Sierra Leone |
0,02 |
21.43 |
6.21 |
7.87 |
26.23 |
2/5 |
Bien |
Côte d’Ivoire |
0,15 |
12,50 |
4.34 |
5.48 |
18.27 |
1/5 |
Très bien |
Ghana |
2.43 |
17.44 |
10.33 |
10.91 |
36.37 |
2/5 |
Bien |
Aller |
0,01 |
16h30 |
2,95 |
4.39 |
14.63 |
1/5 |
Très bien |
Bénin |
0,00 |
14,85 |
4.83 |
5.61 |
18,70 |
1/5 |
Très bien |
Sao Tomé-et-Principe |
0,02 |
12.19 |
2.64 |
4.12 |
13.73 |
1/5 |
Très bien |
Moyenne |
0,31 |
18.04 |
5.92 |
7.27 |
24.23 |
2/5 |
Bien |
Tableau 8 : Valeurs de l’indicateur de précision
RMSE (Px) |
Précision |
|---|---|
< 1/5 Px |
Très bien |
1/5 px - 2/5 px |
Bien |
2/5 px - 3/5 px |
Modéré |
3/5 px - 4/5 px |
Faible |
> 4/5 Px |
Très faible |
Mises en garde et limites
Les lignes de côte annuelles résument la position médiane (c’est-à-dire « dominante ») du littoral tout au long de l’année, corrigée en fonction d’une hauteur de marée constante (0 m AMSL). Les lignes de côte annuelles ne reflètent donc pas la variabilité côtière à court terme, par exemple les changements de position du littoral entre la marée basse et la marée haute, les effets saisonniers ou les influences de courte durée de certaines tempêtes. Cela signifie que ces lignes de côte annuelles présenteront une variabilité inférieure à la véritable plage de variabilité côtière observée le long du littoral africain.
Les taux de changement n’expliquent pas les raisons du changement et ne représentent pas nécessairement les processus d’érosion côtière ou d’élévation du niveau de la mer. Dans les endroits qui connaissent un développement côtier rapide, la construction de nouvelles criques ou de marinas peut être représentée comme des points chauds de recul du littoral, tandis que la construction de ports ou de jetées peut être représentée comme des points chauds de croissance du littoral. Les points de taux de changement doivent donc être évalués en référence aux littoraux annuels sous-jacents et à des sources de données ou d’imagerie externes.
Les statistiques sur les taux de changement peuvent être inexactes ou invalides dans les embouchures complexes ou dans d’autres environnements côtiers qui subissent des changements rapides et non linéaires au fil du temps. Dans ces régions, il est conseillé d’évaluer visuellement les données annuelles sous-jacentes du littoral lors de l’interprétation des taux de changement afin de s’assurer que ces valeurs sont adaptées à l’objectif.
Problèmes de qualité des données
Les lignes de côte annuelles peuvent être moins précises dans les régions où la dynamique des marées est complexe ou où les marées sont importantes, et dans les vasières intertidales de faible altitude où de petites erreurs de modélisation des marées peuvent entraîner d’importants décalages horizontaux dans les positions des côtes. La précision des lignes de côte annuelles dans les environnements intertidaux peut également être réduite par l’influence d’un substrat boueux humide ou de la végétation intertidale, ce qui peut rendre difficile l’extraction d’une ligne de côte unique et sans ambiguïté. On prévoit que les futures versions de ce produit afficheront de meilleurs résultats grâce à l’intégration de méthodes plus avancées de détection des lignes de flottaison dans les régions intertidales et grâce à des améliorations des méthodes de modélisation des marées. Les lignes de côte peuvent être plus bruyantes et plus difficiles à interpréter dans les régions où la disponibilité des observations par satellite est faible en raison d’une couverture nuageuse persistante. Dans ces régions, il peut être difficile d’obtenir le nombre minimum d’observations par satellite claires requis pour générer des lignes de côte annuelles propres et sans bruit.
Dans certaines zones urbaines, les spectres des bâtiments blancs brillants situés près du littoral peuvent être confondus par inadvertance avec ceux de l’eau, provoquant un décalage vers la terre par rapport aux véritables positions du littoral.
Certaines zones d’ombres extrêmement sombres et persistantes (par exemple, les falaises côtières abruptes) peuvent être cartographiées par inadvertance comme de l’eau, ce qui entraîne un décalage vers la terre par rapport aux véritables positions du littoral.
Certaines îles relativement petites de l’océan Indien ne sont pas bien cartographiées par cette technique car le nombre de données sans nuages appropriées tout au long de l’année est insuffisant pour créer un littoral annuel représentatif.