Global Root-zone moisture Analysis & Forecasting System (GRAFS)
Both datasets are external to the Digital Earth Africa platform.
Keywords: data used; ERA5, datasets; ERA5, data used; GRAFS, datasets; GRAFS, soil moisture, precipitation
Background
Soil moisture is a measure of water stored in the soil zone that is accessible to plant roots, making it a major contributing factor to plant health and crop yield.
The Global Root-zone moisture Analysis & Forecasting System (GRAFS) is produced by the ANU Centre for Water and Landscape Dynamics. The model estimates the surface (0-5 cm) and root-zone (0-1 m) soil moisture at 10 km spatial resolution globally, using the precipitation measured by the Global Precipitation Measurement (GPM) mission and through assimilation of the soil moisture product from the Soil Moisture Active/Passive (SMAP) mission.
This product is regularly updated and made available through National Computational Infrastructure’s open access THREDDS data server.
For more information on this product, contact Luigi Renzullo and Siyuan Tian.
Description
This notebook demonstrates the following steps:
Retrieval of surface and root-zone wetness through NCI’s THREDDS OPeNDAP service
Compare soil moisture to precipitation data from ERA5
Getting started
To run this analysis, run all the cells in the notebook, starting with the “Load packages” cell.
Load packages
Import Python packages that are used for the analysis.
[1]:
%matplotlib inline
from matplotlib import pyplot as plt
import xarray as xr
import numpy as np
import datacube

from deafrica_tools.load_era5 import load_era5
from deafrica_tools.load_soil_moisture import load_soil_moisture
Analysis parameters
Define location and time period of interest. The time period is chosen to be less than a year to limit ERA5 data download.
[2]:
# Define the analysis region (Lat-Lon box)

# Il Ngwesi region of Kenya - Rhino Project
lat = (0.412, 0.266)
lon = (37.32, 37.40)

# High Energy Stereoscopic System site near Windhoek Namibia
#lat = (-23.28, -23.26)
#lon = (16.49, 16.51)

# Define the time window
time = '2018-07-01', '2019-05-31'
Retrieval of surface and root-zone wetness
Surface wetnessis measured relative to wettest condition recorded for a location.
Rootzone Soil Water Indexis derived from surface relative wetness
[3]:
# Retrieve surface soil moisture using query parameters
surface_wetness = load_soil_moisture(lat, lon, time, grid='nearest')
https://dapds00.nci.org.au/thredds/dodsC/ub8/global/GRAFS/GRAFS_TopSoilRelativeWetness_2018.nc
https://dapds00.nci.org.au/thredds/dodsC/ub8/global/GRAFS/GRAFS_TopSoilRelativeWetness_2019.nc
[4]:
# retrieve rootzone soil moisture using query parameters
rootzone_wetness = load_soil_moisture(lat, lon, time, product='rootzone', grid='nearest')
https://dapds00.nci.org.au/thredds/dodsC/ub8/global/GRAFS/GRAFS_RootzoneSoilWaterIndex_2018.nc
https://dapds00.nci.org.au/thredds/dodsC/ub8/global/GRAFS/GRAFS_RootzoneSoilWaterIndex_2019.nc
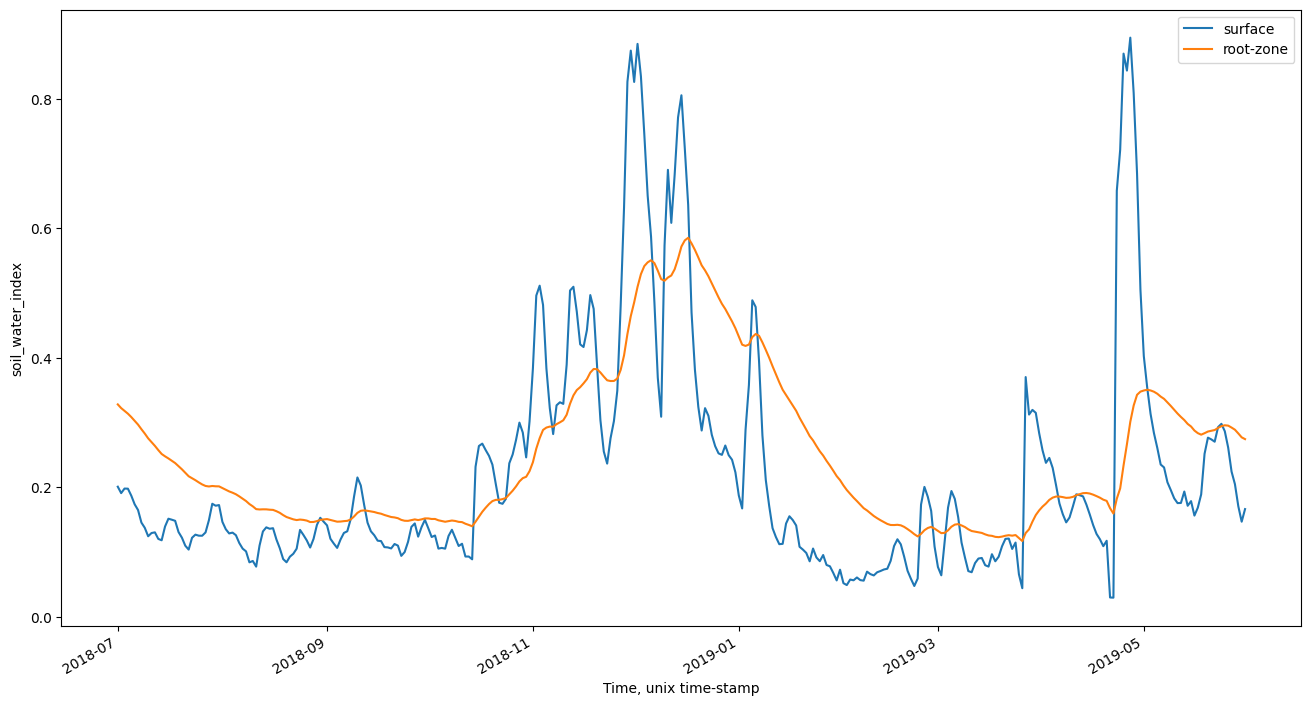
Plot surface and root-zone wetness over time
[5]:
surface_wetness.relative_wetness.mean(['lat','lon']).plot(figsize=(16,8), label='surface');
rootzone_wetness.soil_water_index.mean(['lat','lon']).plot(label='root-zone');
plt.legend()
[5]:
<matplotlib.legend.Legend at 0x7f098e618a30>
Compare soil moisture to precipitation data from ERA5
The first cell will load the precipitation parameter, precipitation_amount_1hour_Accumulation, from ERA5. Depending on the size of your query, this step can take a few minutes to complete. Data will be stored in the folder era5.
[6]:
# load precipitation data from ERA5
var_precipitation = 'total_precipitation_24hr'
precipitation = load_era5(var_precipitation, lat, lon, time, reduce_func=np.sum)

# Convert from Meters (m) to Millimeters (mm)
precipitation[var_precipitation]=precipitation[var_precipitation]*1000
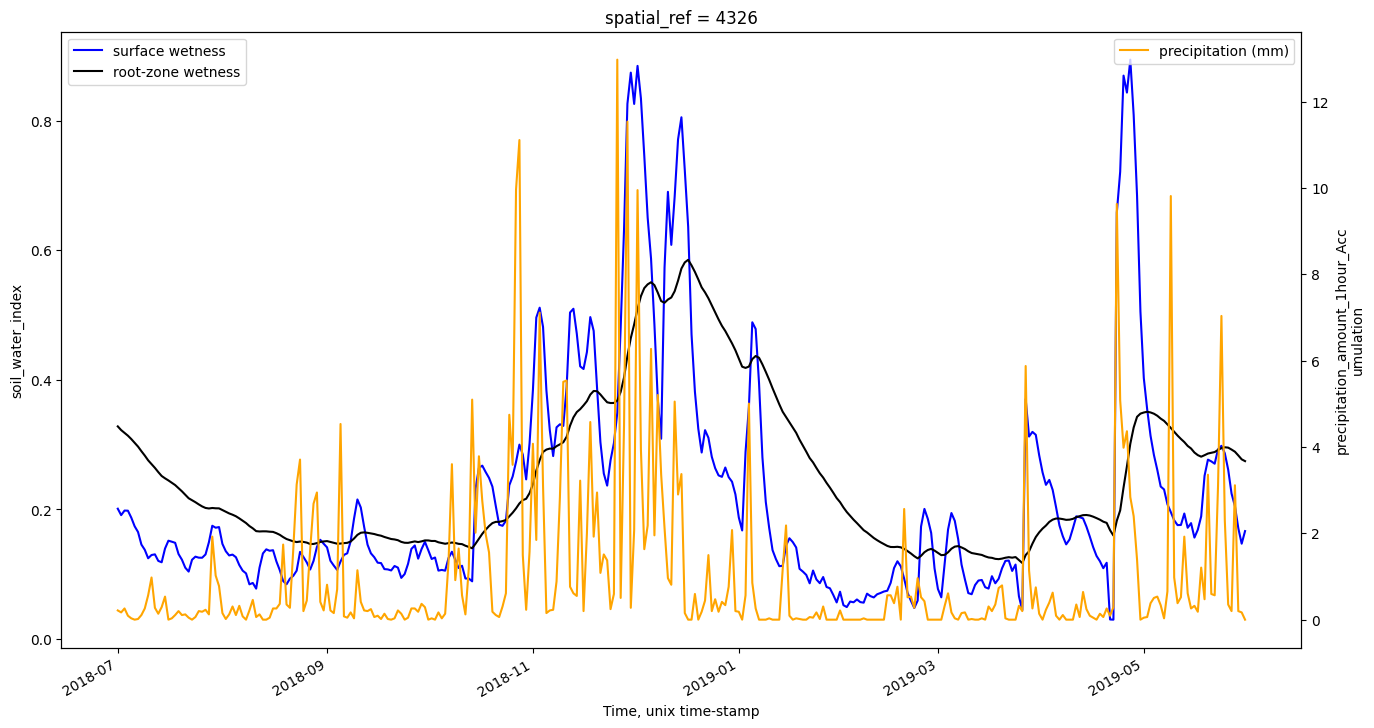
Plot soil moisture with precipitation
[7]:
# plot soil moisture with precipitation

fig, ax1 = plt.subplots(figsize=(16,8))
ax2 = ax1.twinx()
surface_wetness.relative_wetness.mean(['lat','lon']).plot(ax = ax1, label = 'surface wetness', color = 'blue');
rootzone_wetness.soil_water_index.mean(['lat','lon']).plot(ax = ax1, label = 'root-zone wetness', color = 'black');
precipitation[var_precipitation].mean(['lat','lon']).plot(ax = ax2, label = 'precipitation (mm)', color = 'orange');
ax1.legend()
ax2.legend();
Additional information
License: The code in this notebook is licensed under the Apache License, Version 2.0. Digital Earth Africa data is licensed under the Creative Commons by Attribution 4.0 license.
Contact: If you need assistance, please post a question on the Open Data Cube Slack channel or on the GIS Stack Exchange using the open-data-cube tag (you can view previously asked questions here). If you would like to report an issue with this notebook, you can file one on
Github.
Compatible datacube version:
[8]:
print(datacube.__version__)
1.8.15
Last Tested:
[9]:
from datetime import datetime
datetime.today().strftime('%Y-%m-%d')
[9]:
'2024-02-01'