Modélisation du débit à Mohembo à partir des précipitations du bassin supérieur
Produits utilisés : ERA5
Description
Les données de débit à Mohembo deviennent beaucoup plus rares à l’ère des observations satellitaires de bonne qualité, ce qui les rend peu fiables pour comparer le débit avec l’étendue des eaux de surface. Ce carnet tentera de modéliser le débit à Mohembo en utilisant les précipitations en amont extraites de l’ERA5 dans un carnet précédent
Commencer
Pour exécuter cette analyse, exécutez toutes les cellules du bloc-notes, en commençant par la cellule « Charger les packages ».
Charger des paquets
Importez les packages Python utilisés pour l’analyse.
[1]:
%matplotlib inline
import warnings
import datetime as dt
import numpy as np
import pandas as pd
import seaborn as sns
from scipy import stats
import matplotlib.pyplot as plt
from sklearn.metrics import mean_absolute_error
from sklearn.linear_model import LinearRegression
from sklearn.ensemble import RandomForestRegressor
from sklearn.model_selection import train_test_split

from deafrica_tools.spatial import xr_rasterize
from deafrica_tools.load_era5 import load_era5
[2]:
warnings.filterwarnings("ignore")
Paramètres d’analyse
[3]:
upstream_rainfall_1989_2009 = 'results/upstream_rainfall_daily_1989-01_to_2009-12.csv'

upstream_rainfall_2010_2021 = 'results/upstream_rainfall_daily_2010-01_to_2021-05-26.csv'

freq='Q-DEC'

max_lags = 3

sklearn_model = RandomForestRegressor
Récupérer les données historiques de précipitations sur toutes les zones d’intérêt
Ces données ont déjà été récupérées à partir d’ERA5, nous pouvons donc simplement récupérer le fichier csv sur le disque
[4]:
upstream_rainfall_1989_2009 = pd.read_csv(upstream_rainfall_1989_2009, index_col='time',parse_dates=True)
upstream_rainfall_2010_2021 = pd.read_csv(upstream_rainfall_2010_2021, index_col='time',parse_dates=True)
rain = pd.concat([upstream_rainfall_1989_2009, upstream_rainfall_2010_2021])
Il n’est pas nécessaire de réexécuter cette opération puisque les données ont été enregistrées dans le dossier « résultats/ »
[5]:
# # Original shapefile from https://data.apps.fao.org/map/catalog/srv/api/records/57bb1c95-2f00-4def-886f
# vector_file = 'data/OB_FWR_Hydrography_Okavango_Subasins_polygon.geojson'

# # define time period of interest
# time_range = '1989-01', '2009-12'

# # load basin polygons
# # Original shapefile from https://data.apps.fao.org/map/catalog/srv/api/records/57bb1c95-2f00-4def-886f-caee3d756da9
# basin = gpd.read_file(vector_file)

# # upstream include Cuito and Cubango subbasins
# upstream = basin[basin.Subbasin.isin(['Cuito', 'Cubango'])]
# print(upstream)

# # get historical rainfall for upstream and delta
# bounds = upstream.total_bounds
# lat = bounds[1], bounds[3]
# lon = bounds[0], bounds[2]

# # download ERA5 rainfall and aggregate to monthly
# var = 'precipitation_amount_1hour_Accumulation'
# precip = load_era5(var, lat, lon, time_range, reduce_func=np.sum, resample='1D').compute()

# # fix inconsistency in axis names
# precip = precip.rename({'lat':'latitude', 'lon':'longitude'})

# upstream_raster = xr_rasterize(upstream, precip, x_dim='longitude', y_dim='latitude')

# upstream_rainfall = precip[var].where(upstream_raster).sum(['latitude','longitude'])

# upstream_rainfall.to_dataframe().drop('spatial_ref',axis=1).rename({'precipitation_amount_1hour_Accumulation':'cumulative daily rainfall (mm)'},axis=1).to_csv(f'results/upstream_rainfall_daily_{time_range[0]}_to_{time_range[1]}.csv')
Données sur les rejets d’importation
[6]:
discharge = 'data/mohembo_daily_water_discharge_data.csv'
dis=pd.read_csv(discharge)
dis['date'] = pd.to_datetime(dis['date'], dayfirst=True)
dis = dis.set_index('date')
Adapter le débit aux précipitations
[7]:
dis = dis.loc[(dis.index >= rain.index[0])]
[8]:
df = rain.join(dis, how='outer')
df.tail()
[8]:
| cumulative daily rainfall (mm) | water_discharge | |
|---|---|---|
| 2021-05-22 | 0.0 | 201.356 |
| 2021-05-23 | 0.0 | 202.850 |
| 2021-05-24 | 0.0 | 200.148 |
| 2021-05-25 | 0.0 | 192.258 |
| 2021-05-26 | 0.0 | 193.073 |
Rééchantillonner les totaux cumulatifs saisonniers ou mensuels
En intégrant les précipitations sur une période plus longue (des mois aux saisons), nous pouvons mieux corréler les précipitations cumulées en amont avec le débit à Mohembo.
[9]:
#total rainfall per month
df = df.resample(freq).sum()
df.head()
[9]:
| cumulative daily rainfall (mm) | water_discharge | |
|---|---|---|
| 1989-03-31 | 114.574218 | 41274.290 |
| 1989-06-30 | 22.230042 | 38089.340 |
| 1989-09-30 | 0.119446 | 20520.900 |
| 1989-12-31 | 37.682495 | 11343.479 |
| 1990-03-31 | 137.858338 | 24604.860 |
Diviser l’ensemble de données à partir de 2010. De cette façon, nous pouvons construire un modèle sur l’ensemble de données historiques complet, puis prédire sur l’enregistrement incomplet à partir de 2010
[10]:
df_2010 = df.loc[(df.index >= pd.to_datetime('2010-01-01'))]
df_1989 = df.loc[(df.index < pd.to_datetime('2010-01-01'))]
df_1989.tail()
[10]:
| cumulative daily rainfall (mm) | water_discharge | |
|---|---|---|
| 2008-12-31 | 95.044922 | 12850.7990 |
| 2009-03-31 | 125.729308 | 45340.2135 |
| 2009-06-30 | 6.483582 | 49117.4010 |
| 2009-09-30 | 1.598633 | 18477.3465 |
| 2009-12-31 | 82.677734 | 13901.3405 |
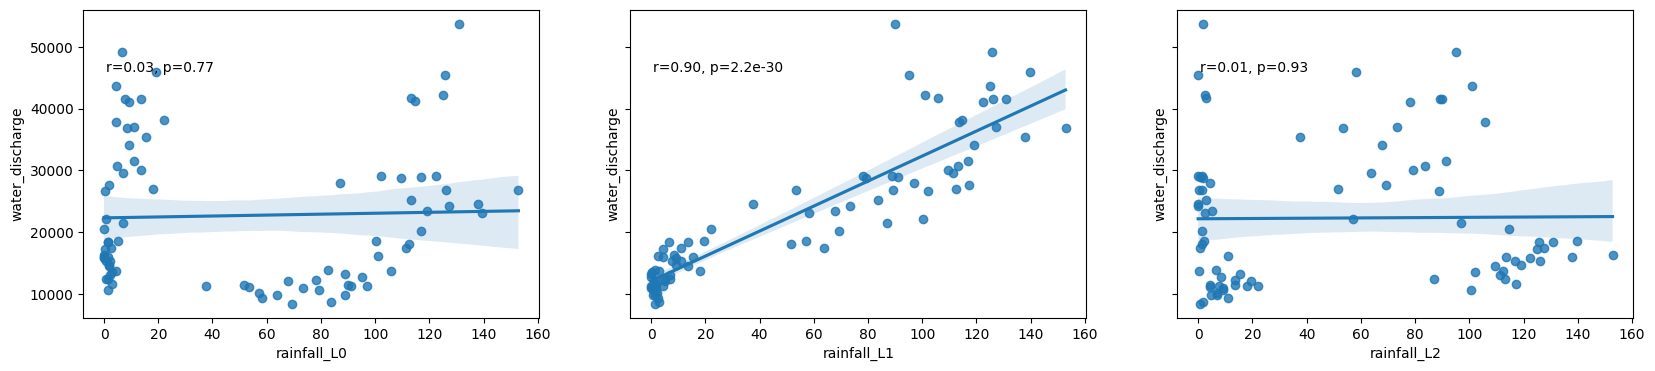
Étudier les corrélations avec les décalages dans les précipitations
[11]:
def crosscorr(datay, datax, lag=0):
    """
    Lag-N cross correlation.

    lag : int, default 0
    datax, datay : pandas.Series objects of equal length

    """
    return datay.corr(datax.shift(lag))
[12]:
# calculate cross correlation for each lag period
xcov = [crosscorr(df_1989['water_discharge'], df_1989['cumulative daily rainfall (mm)'], lag=i) for i in range(max_lags)]

# Scatter plots of the relationship between rainfall and discharge at each lag
fig, ax = plt.subplots(1,max_lags, figsize=(20,4), sharey=True)
for lag in range(max_lags):
    df_1989['rainfall_L'+str(lag)] = df_1989['cumulative daily rainfall (mm)'].shift(lag)
    sns.regplot(x='rainfall_L'+str(lag), y='water_discharge', data=df_1989, ax=ax[lag])
    r, p = stats.pearsonr(df_1989['rainfall_L'+str(lag)][lag:], df_1989['water_discharge'][lag:])
    ax[lag].text(.05, .8, 'r={:.2f}, p={:.2g}'.format(r, p), transform=ax[lag].transAxes)
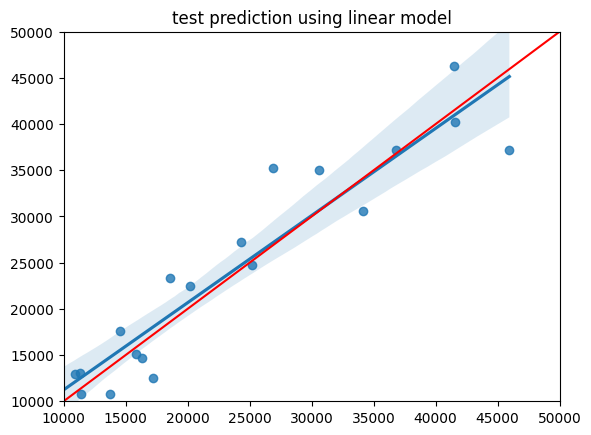
Modélisation par régression
Modélisez la relation entre les précipitations et le débit en utilisant le décalage qui correspond à la corrélation la plus élevée
Effectuez d’abord un test/une formation pour avoir une idée de la précision générale de cette approche.
[13]:
max_value = max(xcov)
best_lag = xcov.index(max_value)
print("Best lag:",best_lag)
Best lag: 1
[14]:
#convert data into a format that scikit learn likes
X = df_1989['rainfall_L'+str(best_lag)][best_lag:].values.reshape(-1,1)
y = df_1989['water_discharge'][best_lag:].values.reshape(-1,1)

#conduct a train test split
X_train,X_test, y_train, y_test = train_test_split(X, y, test_size=0.25, random_state=1)

#model the relationship using just the training data, then predict on test data
model = sklearn_model()
model.fit(X_train,y_train)
y_pred = model.predict(X_test)

print('MAE: ',mean_absolute_error(y_test,y_pred))

#plot result of test data
sns.regplot(x=y_test, y=y_pred)
plt.xlim(10000, 50000)
plt.ylim(10000, 50000)
plt.plot([10000, 50000], [10000, 50000], 'k-', color = 'r')
plt.title('test prediction using linear model');
MAE: 3267.4222390809487
Prédire la décharge à Mohembo
Récupérez les précipitations de la période que nous souhaitons prédire
[15]:
fc_rainfall=df['cumulative daily rainfall (mm)'].shift(best_lag)
X_fc = fc_rainfall[best_lag:].values.reshape(-1,1)
Faire une prévision à l’aide des données de précipitations
[16]:
# model = LinearRegression()
model = sklearn_model()
model.fit(X,y) #train 1989-2010
fc = model.predict(X_fc) # predict on all data
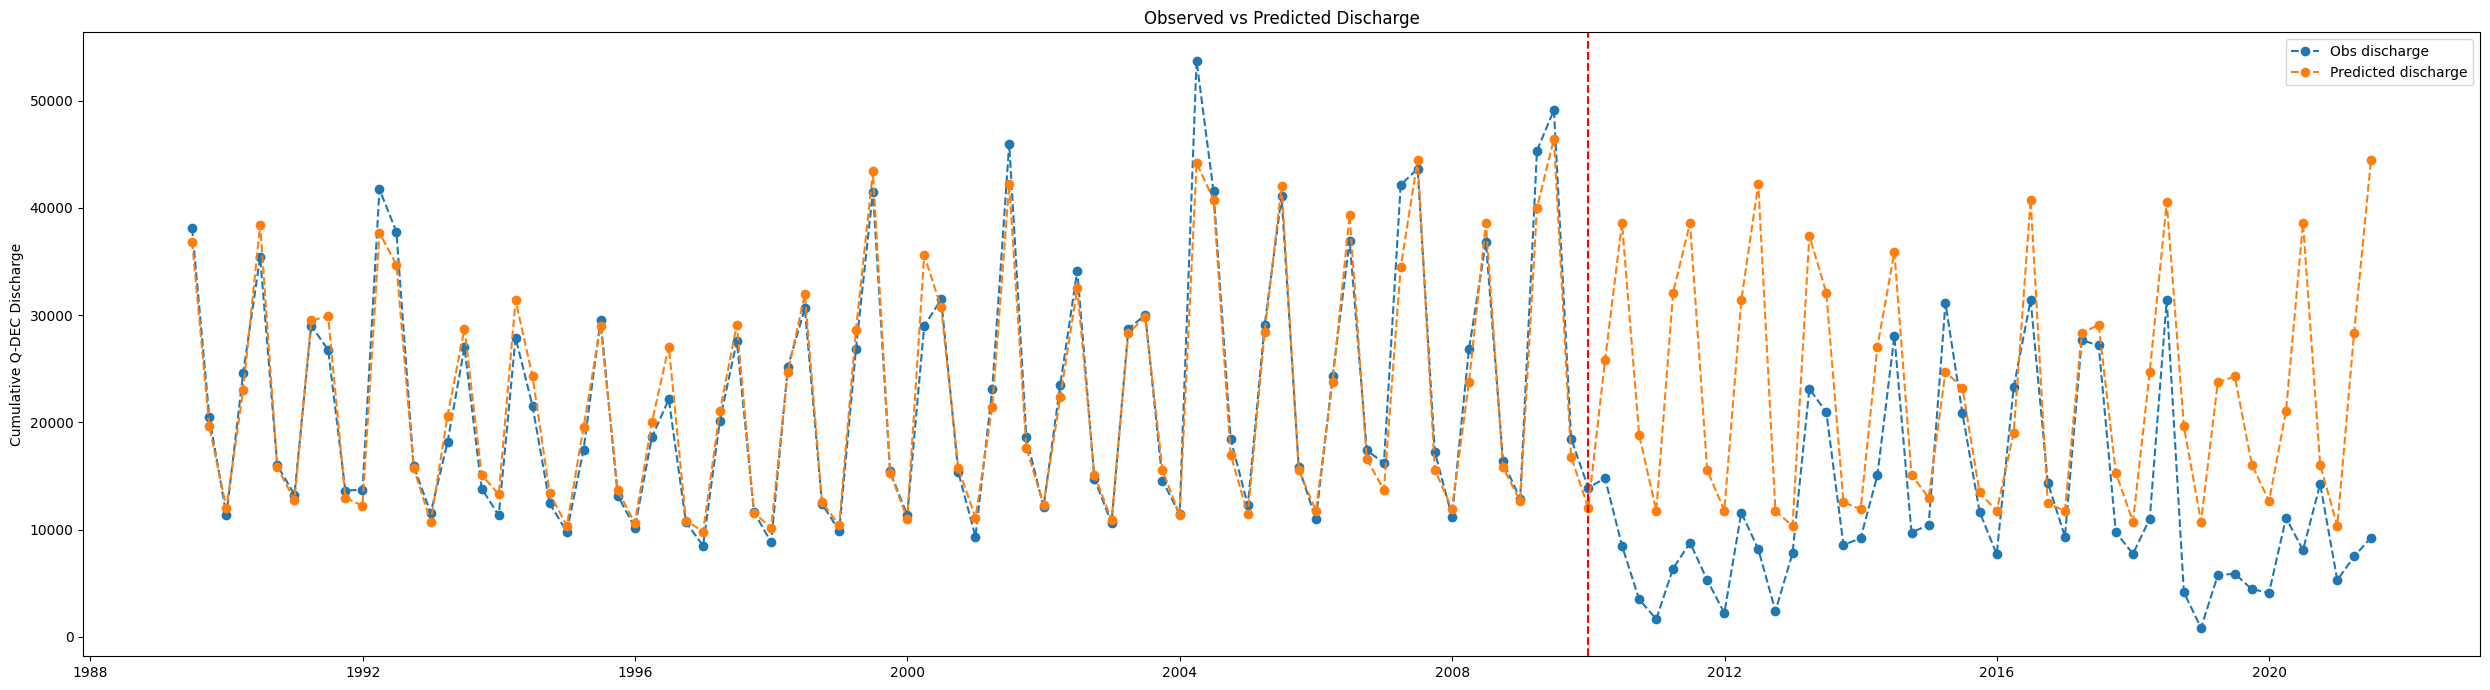
Tracer le débit observé par rapport au débit prévu sous forme de série chronologique
[17]:
df_predicted = df[best_lag:]
df_predicted['predicted_discharge'] = fc.reshape(-1)
df_predicted.head(2)
[17]:
| cumulative daily rainfall (mm) | water_discharge | predicted_discharge | |
|---|---|---|---|
| 1989-06-30 | 22.230042 | 38089.34 | 36847.73170 |
| 1989-09-30 | 0.119446 | 20520.90 | 19623.61006 |
Imprimer l’erreur absolue moyenne
[18]:
mean_absolute_error(df_predicted.loc[(df_predicted.index < pd.to_datetime('2010-01-01'))]['water_discharge'],
                   df_predicted.loc[(df_predicted.index < pd.to_datetime('2010-01-01'))]['predicted_discharge'])
[18]:
1562.6560681098642
[19]:
fig, ax = plt.subplots(figsize=(25,7))

ax.plot(df_predicted['water_discharge'], label='Obs discharge', linestyle='dashed', marker='o')
ax.plot(df_predicted['predicted_discharge'], label = 'Predicted discharge', linestyle='dashed', marker='o')
ax.legend()
plt.title('Observed vs Predicted Discharge')
ax.set_ylabel('Cumulative '+freq+' Discharge')
ax.axvline(dt.datetime(2010, 1, 1), c='red',linestyle='dashed')
ax.set_xlabel('')
plt.tight_layout();
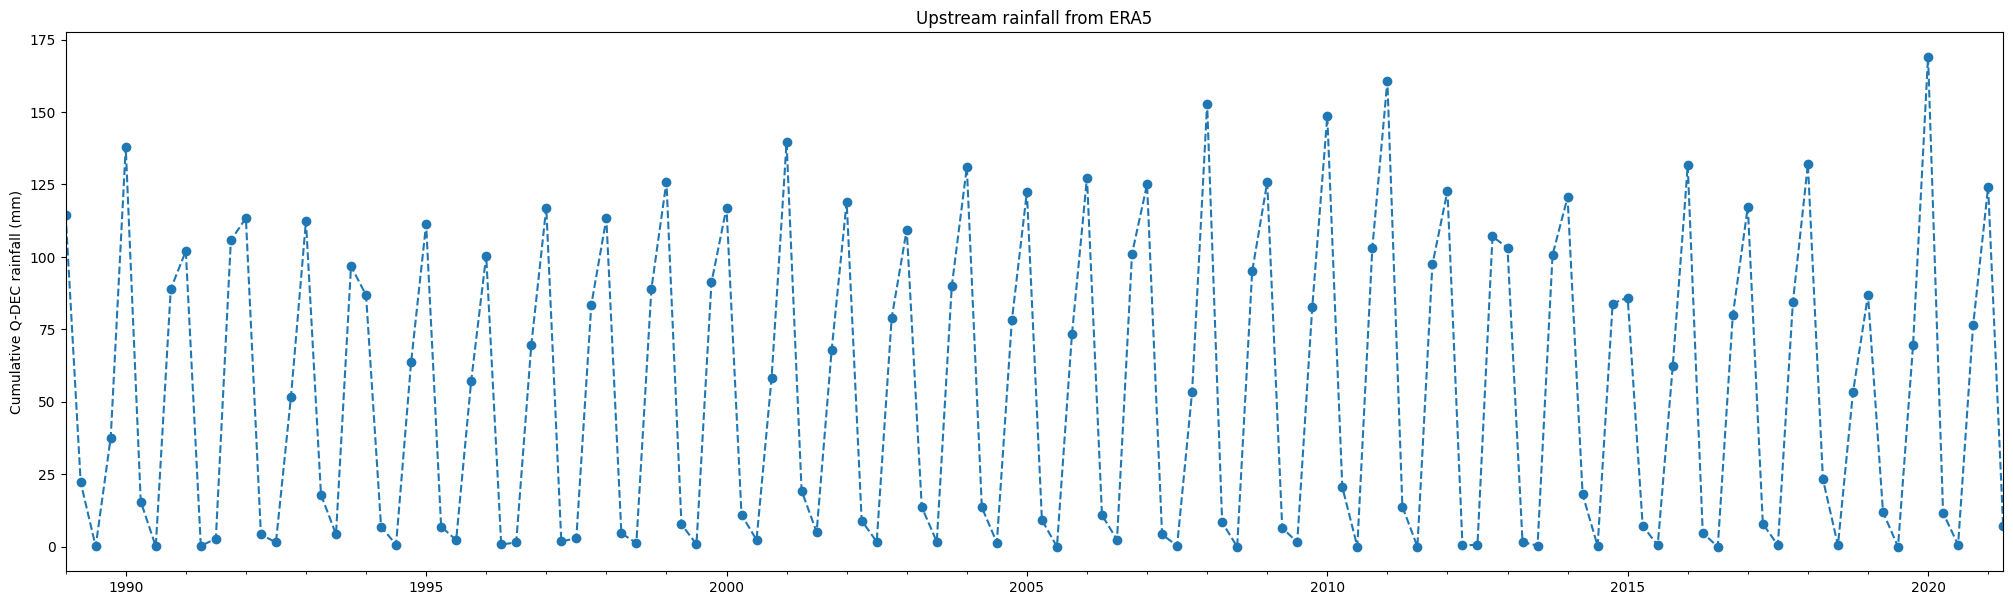
Parcelle pluviométrique
[20]:
df['cumulative daily rainfall (mm)'].plot(linestyle='dashed', marker='o',figsize=(25,7))
plt.title('Upstream rainfall from ERA5')
plt.ylabel('Cumulative '+freq+' rainfall (mm)')
plt.xlabel('');
[21]:
data = 'results/okavango_all_datasets.csv'
ok_r=pd.read_csv(data, index_col='time', parse_dates=True)[['okavango_rain']]
Enregistrer le résultat sur le disque
[22]:
df_predicted.rename({'cumulative daily rainfall (mm)':'upstream_rainfall'}, axis=1).to_csv('results/modelled_discharge_'+freq+'.csv')
Informations Complémentaires
Licence : Le code de ce carnet est sous licence Apache, version 2.0 <https://www.apache.org/licenses/LICENSE-2.0>. Les données de Digital Earth Africa sont sous licence Creative Commons par attribution 4.0 <https://creativecommons.org/licenses/by/4.0/>.
Contact : Si vous avez besoin d’aide, veuillez poster une question sur le canal Slack Open Data Cube <http://slack.opendatacube.org/>`__ ou sur le GIS Stack Exchange en utilisant la balise open-data-cube (vous pouvez consulter les questions posées précédemment ici). Si vous souhaitez signaler un problème avec ce bloc-notes, vous pouvez en déposer un sur Github.
Dernier test :
[23]:
from datetime import datetime
datetime.today().strftime('%Y-%m-%d')
[23]:
'2023-08-21'