Services Web pour SIG
Service de cartographie Web / Service de couverture Web
Un service de cartographie Web (WMS) est une norme de l’Open Geospatial Consortium (OGC) qui permet aux utilisateurs d’accéder à distance à des images cartographiques géoréférencées via des requêtes de protocole de transfert hypertexte sécurisé (HTTPS).
DE Africa propose deux types de services de cartographie :
Web Map Service (WMS) - Protocole standard permettant de diffuser des images cartographiques géoréférencées sur Internet, générées à partir d’un serveur cartographique à l’aide de données provenant d’une base de données SIG. Il est important de noter qu’avec un WMS, vous obtenez essentiellement une image de données géospatiales (c’est-à-dire un fichier JPG, GIF, PNG). Bien que cela ait son utilité, il s’agit uniquement d’une image et ne contient donc aucune des données géospatiales sous-jacentes qui ont été utilisées pour créer l’image.
Web Coverage Service (WCS) - Un protocole standard pour la diffusion de données de couverture qui renvoie des données avec leur sémantique d’origine (au lieu de simples images) qui peuvent être interprétées, extrapolées, etc., et pas seulement représentées. Essentiellement, un WCS peut être considéré comme les données raster géospatiales brutes derrière une image. À l’aide d’un WCS, vous pouvez extraire les informations raster brutes dont vous avez besoin pour effectuer une analyse plus approfondie.
Web Map Tile Service (WMTS) - Un protocole standard pour la diffusion de tuiles cartographiques géoréférencées pré-rendues sur Internet, comparable à WMS. La principale différence entre WMS et WMTS réside dans la manière dont les données sont fournies au client. WMS fournit les données cartographiques sous la forme d’une seule image, tandis que WMTS fournit les données cartographiques sous la forme d’une série de tuiles pré-rendues côté serveur à différentes échelles et mises en cache côté client, ce qui permet une diffusion plus rapide et une bande passante réduite.
Pour résumer rapidement, un WMS est simplement une image d’une carte. On peut presque considérer cela comme une capture d’écran de Google Maps. Un WMTS est identique à un WMS, sauf que les images sont pré-générées et enregistrées sous forme de petites tuiles cartographiques qui couvrent toute la zone de la carte et à plusieurs échelles. Un WCS est constitué de données raster brutes. Ainsi, par exemple, si vous travaillez avec un WCS contenant des images Landsat, vous pouvez découper efficacement la partie qui vous intéresse et télécharger l’image multispectrale complète à la résolution spatiale de l’image d’origine. L’avantage de ces services est que vous pouvez récupérer uniquement les informations dont vous avez besoin. Ainsi, plutôt que de récupérer un fichier contenant les données que vous recherchez et peut-être bien plus encore, vous pouvez limiter votre téléchargement à votre zone d’intérêt uniquement, ce qui vous permet d’obtenir ce dont vous avez besoin et rien de plus.
Pour plus d’informations, consultez cet article sur la « différence entre les services Web SIG <https://www.l3harrisgeospatial.com/Learn/Blogs/Blog-Details/ArtMID/10198/ArticleID/16289/Web-Mapping-Service-Web-Coverage-Service-or-Web-Feature-Service-%E2%80%93-What%E2%80%99s-the-Difference> »__.
Les tutoriels ci-dessous couvrent :
Mise en place du WMS
Ajout de couches WMS-T (temps pris en charge)
Connexion à WCS
Connexion à WMTS
Les tutoriels ont été créés avec QGIS3 et ArcGIS Pro 3.0.3. Les mêmes processus peuvent être utilisés pour connecter d’autres applications SIG de bureau. QGIS est une application SIG de bureau gratuite et open-source. Vous pouvez la télécharger à partir de https://qgis.org/en/site/.
QGIS
Mise en place du WMS
Ce tutoriel montre comment configurer les services de cartographie Web dans QGIS et les utiliser avec d’autres données sur votre ordinateur, telles que des images de drone, des données vectorielles ou raster. Cela peut vous être utile si vous ne pouvez pas télécharger les données sur la carte DE Africa ou sur le bac à sable DE Africa en raison du téléchargement en raison de la taille ou de la bande passante Internet. Cela peut également être utile si vous vous sentez plus à l’aise pour effectuer des analyses dans une application SIG.
Lancez QGIS.
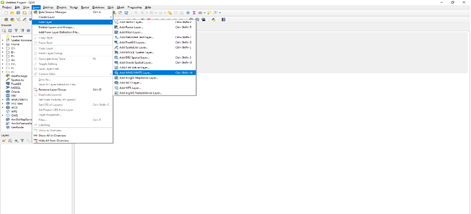
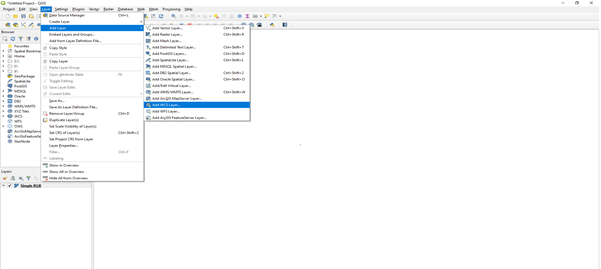
Dans la barre de menu, cliquez sur Calque.
Un onglet de sous-menu s’affichera sous Calque ; cliquez sur Ajouter un calque, choisissez Ajouter un calque WMS/WMTS.
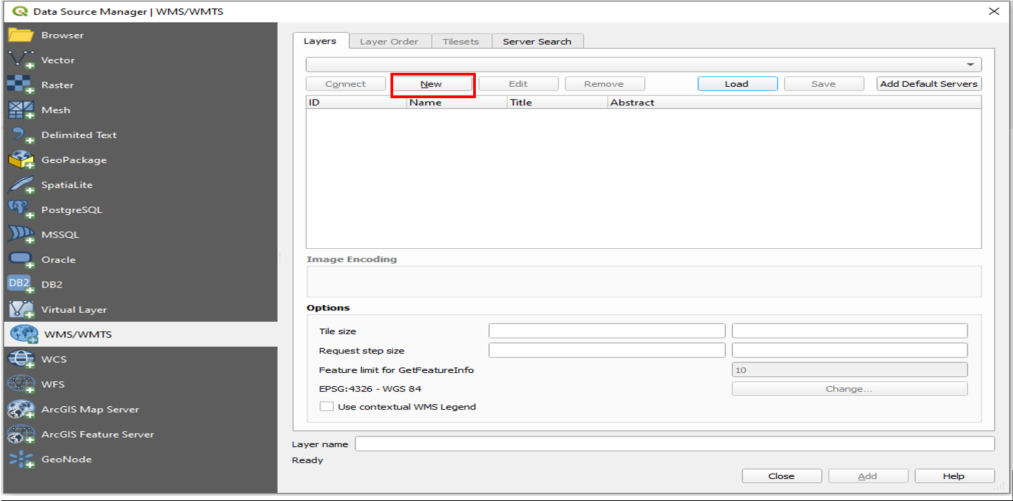
Une boîte de dialogue s’ouvre, comme illustré ci-dessous. Cliquez sur le bouton Nouveau.
Une boîte de dialogue s’ouvrira, comme indiqué ci-dessous : Fournissez les détails suivants, vous les trouverez à l’URL https://ows.digitalearth.africa/.
« Nom : DE Africa Services »
URL: https://ows.digitalearth.africa/wms?version=1.3.0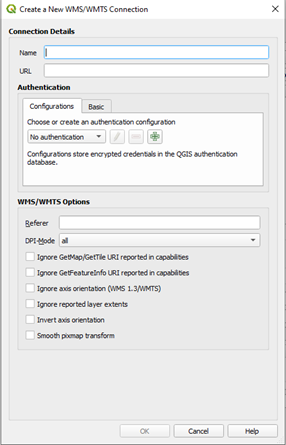
Après avoir fourni les détails ci-dessus, cliquez sur OK.
La boîte de dialogue précédente s’affiche. Dans le menu déroulant situé au-dessus du bouton Nouveau, vous verrez DE Africa Services. Si ce n’est pas le cas, cliquez sur le bouton déroulant ci-dessous et sélectionnez-le.
Le bouton Connecter sera activé, cliquez dessus pour charger les couches. A chaque fois que cette page est ouverte, étant donné que la connexion a déjà été établie, cliquez sur Connecter pour charger les données.
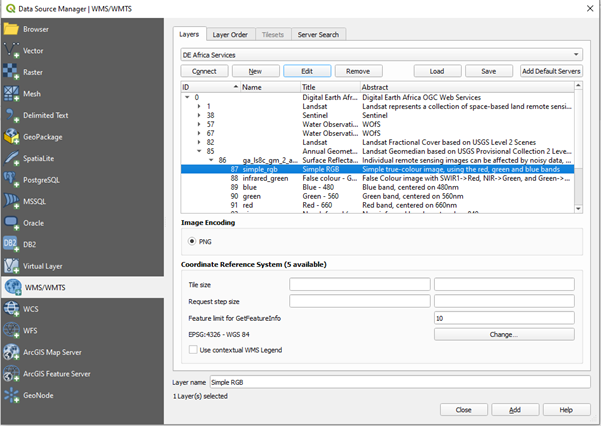
La couche sera chargée comme indiqué ci-dessous dans la boîte de dialogue.
Naviguez dans les calques et choisissez celui que vous devez afficher sur la page Carte.
Après avoir sélectionné le calque, cliquez sur le bouton Ajouter en bas de la boîte de dialogue.
Fermez la boîte de dialogue, la couche sélectionnée sera chargée sur la page Carte.
Pour les développeurs Web
Les sites ci-dessous fournissent des instructions sur la façon de charger ces services cartographiques sur votre plateforme.
https://leafletjs.com/examples/wms/wms.html
Ajouter des couches WMS-T (temps pris en charge)
Les services Web de Digital Earth Africa prennent en charge WMS-T (WMS avec heure). Les couches WMS-T permettent aux utilisateurs de naviguer sur différentes périodes de temps.
Comment ajouter des couches WMS-T à l’aide de QGIS
Connectez-vous au service de carte Web dans QGIS en suivant les instructions du didacticiel de configuration de WMS <#Tutorial:-Setting-up-WMS>`__.
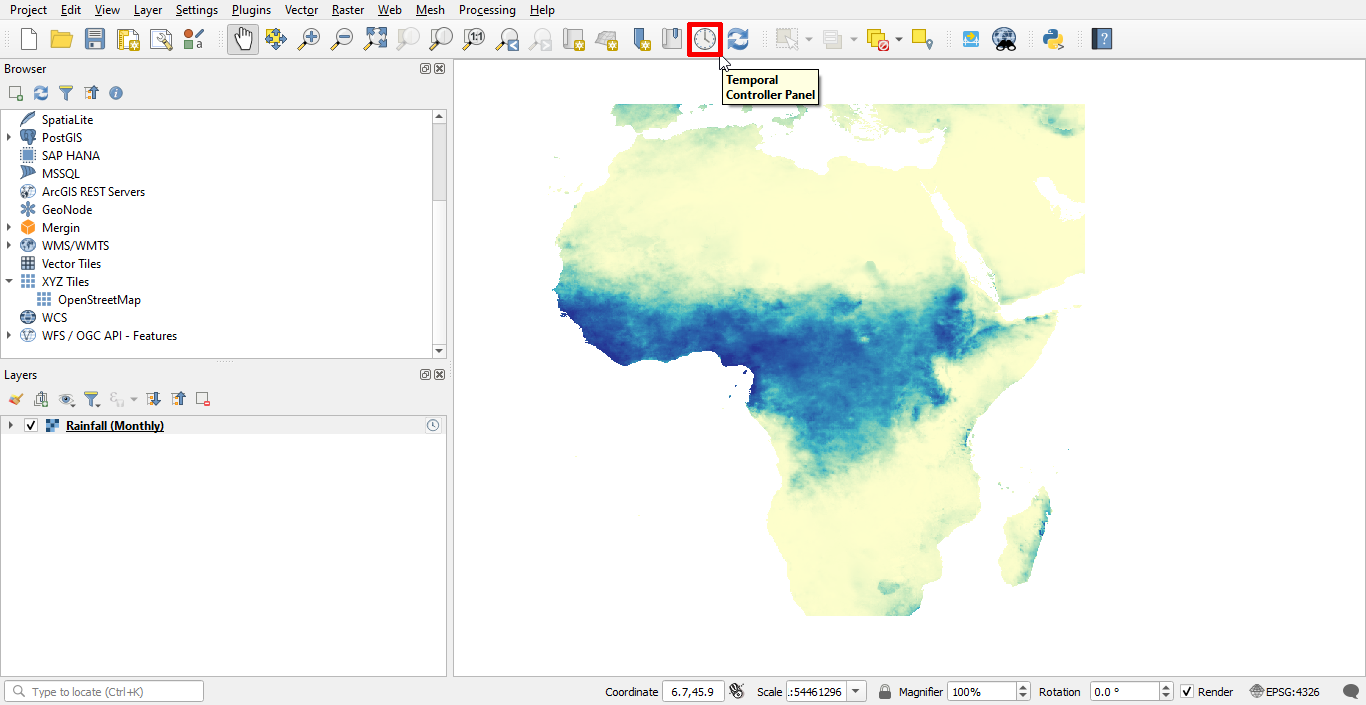
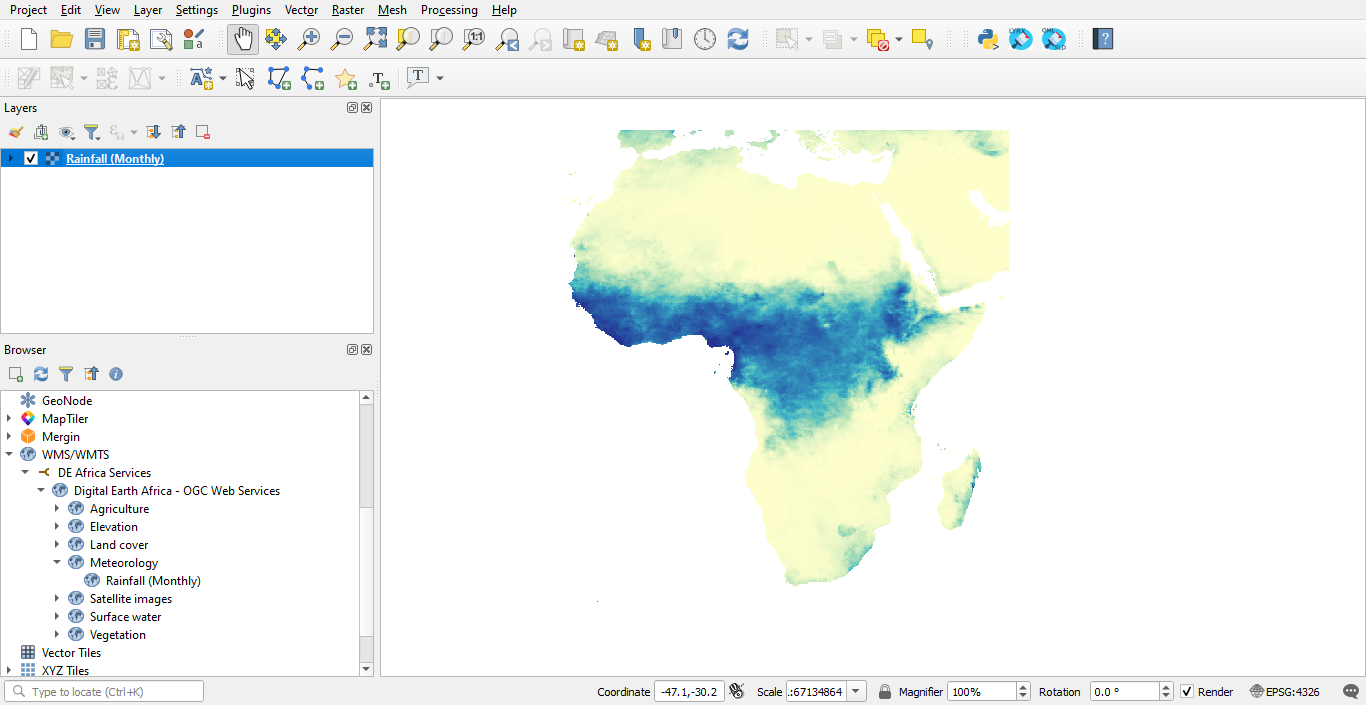
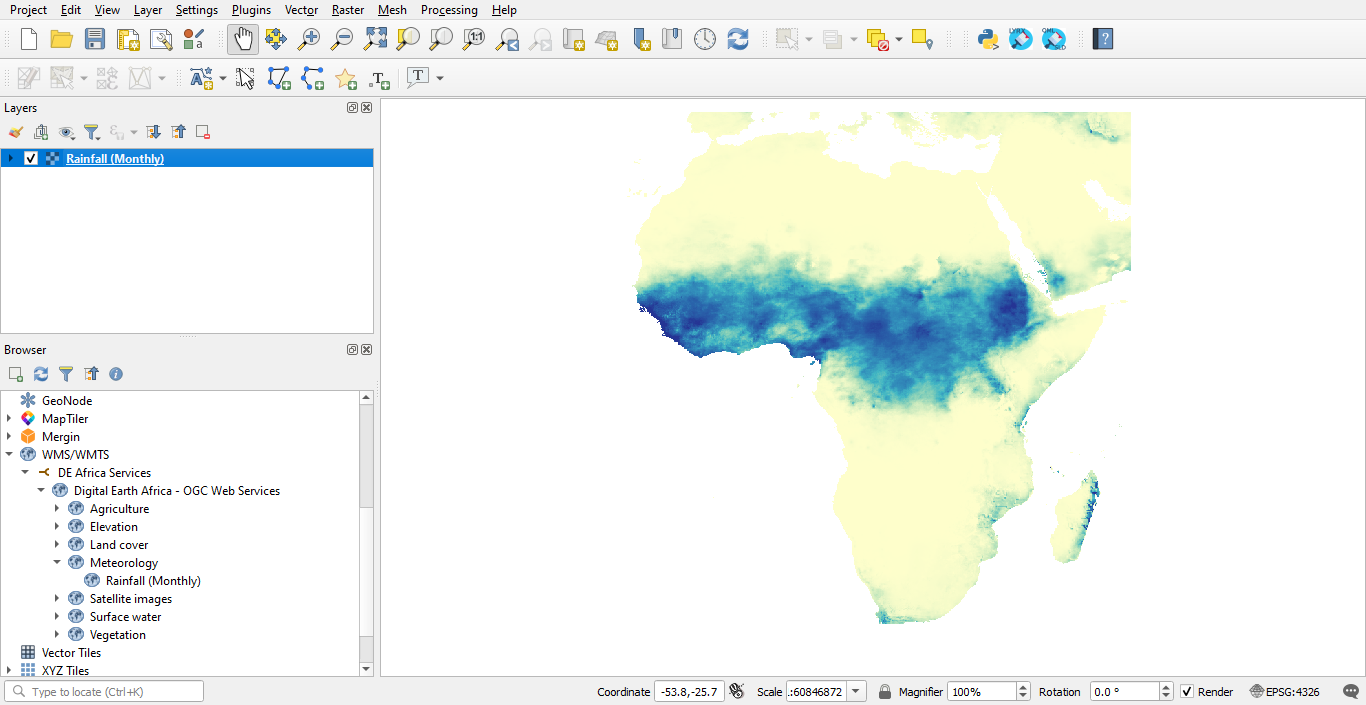
Dans le panneau du navigateur de QGIS, accédez à l’élément fournisseur WMS/WMTS et développez-le pour afficher la connexion DE Africa Services.
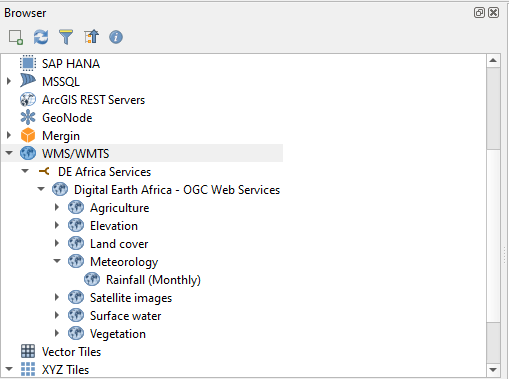
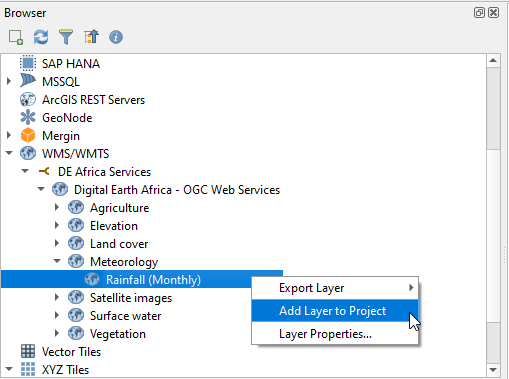
Sélectionnez une couche WMS-T à partir des couches de connexion DE Africa Services en double-cliquant sur l’élément de couche dans le Panneau du navigateur ou en cliquant dessus avec le bouton droit de la souris et en sélectionnant Ajouter une couche au projet pour ajouter la couche sur le canevas de la carte.
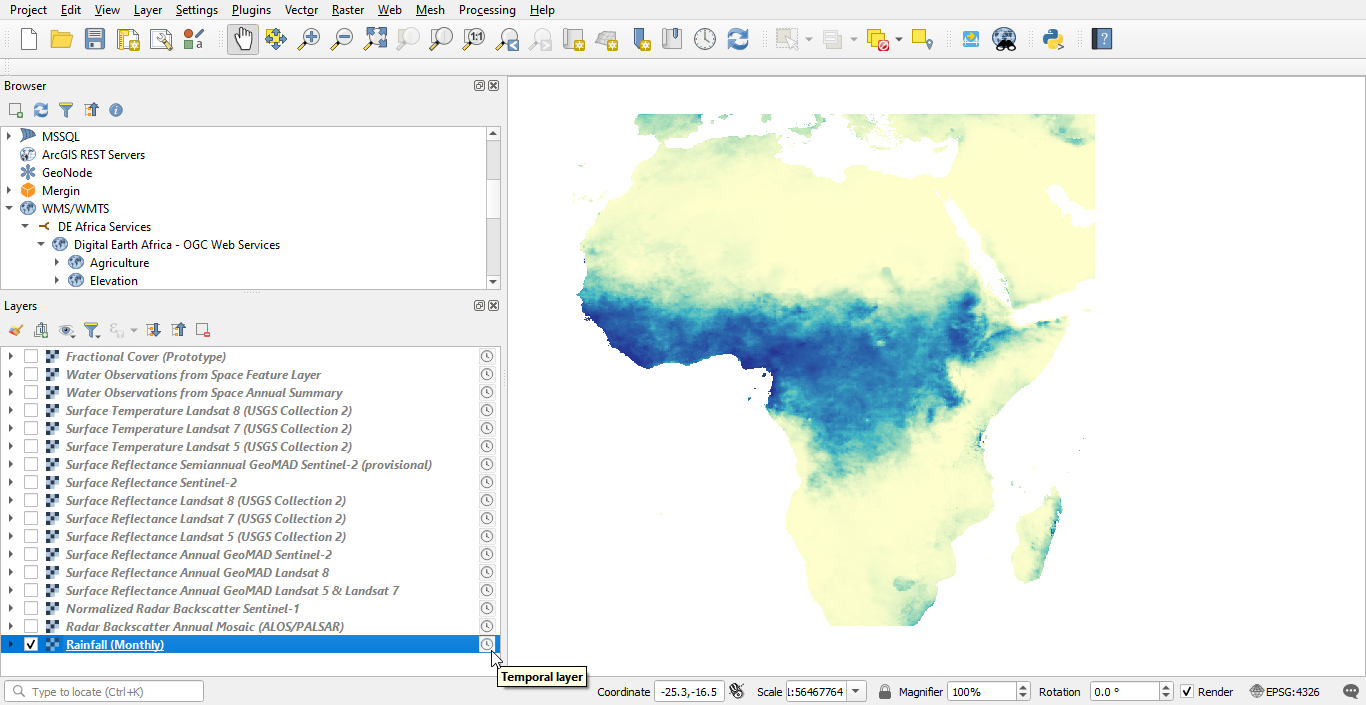
La couche sera chargée dans le panneau Calques avec un symbole d’horloge |indicateur temporel| à côté pour indiquer qu’il s’agit d’une couche temporelle.
Comment utiliser le contrôleur temporel QGIS avec les couches WMS-T
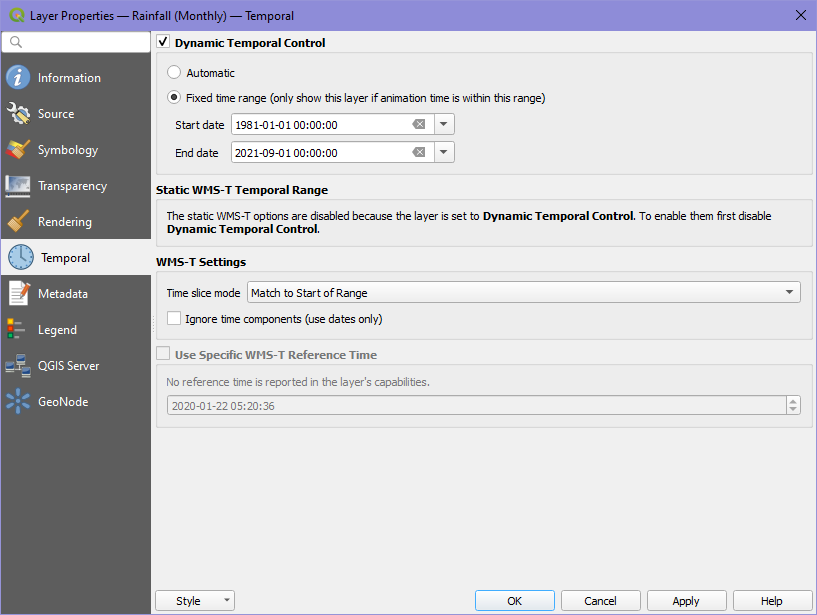
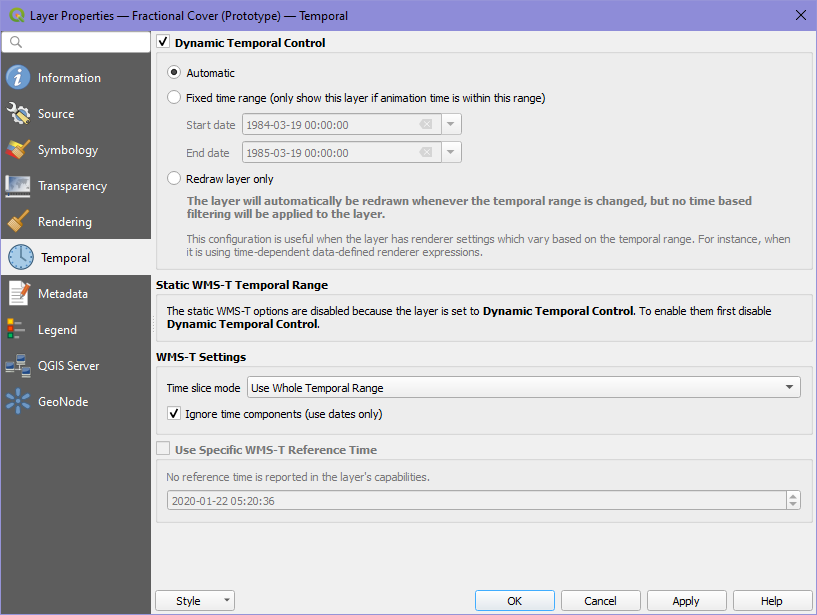
Pour utiliser le Contrôleur temporel pour les couches WMS-T, assurez-vous que dans la section Temporelle des Propriétés de couche de la couche, l’option Contrôle temporel dynamique est sélectionnée. Vous pouvez sélectionner la plage de temps comme étant Automatique ou Plage de temps fixe.
Pour le paramètre Automatique, la gestion temporelle est déléguée au fournisseur de données et un filtrage basé sur le temps est appliqué aux entités de la couche de telle sorte que les entités soient visualisées pour la plage d’animation définie par le Contrôleur temporel.
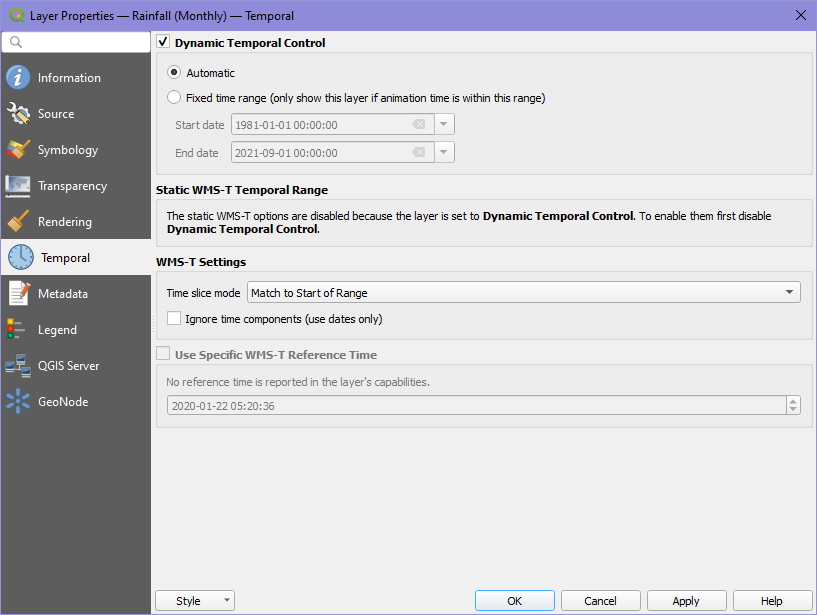
Pour le paramètre Plage temporelle fixe, l’utilisateur définit manuellement la plage temporelle dans laquelle toutes les fonctionnalités de la couche seront visualisées uniquement si la plage d’animation du Contrôleur temporel se situe dans cette plage temporelle.
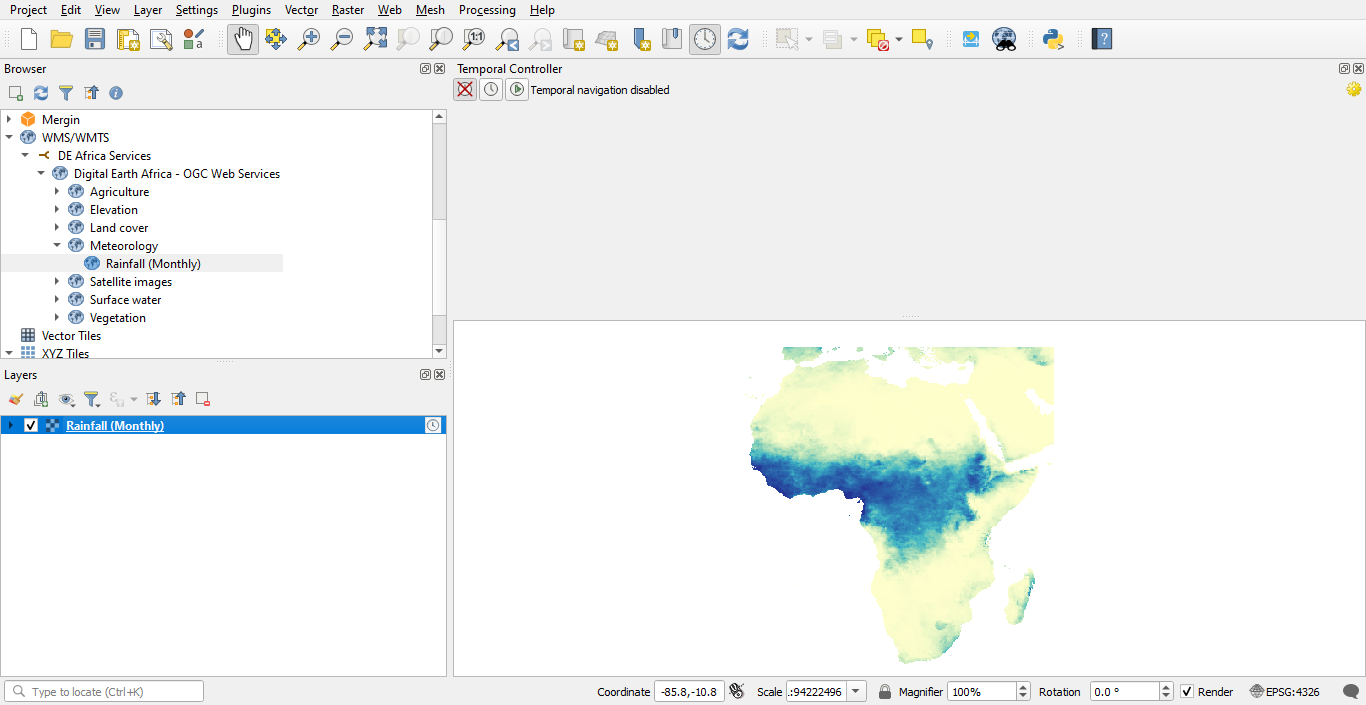
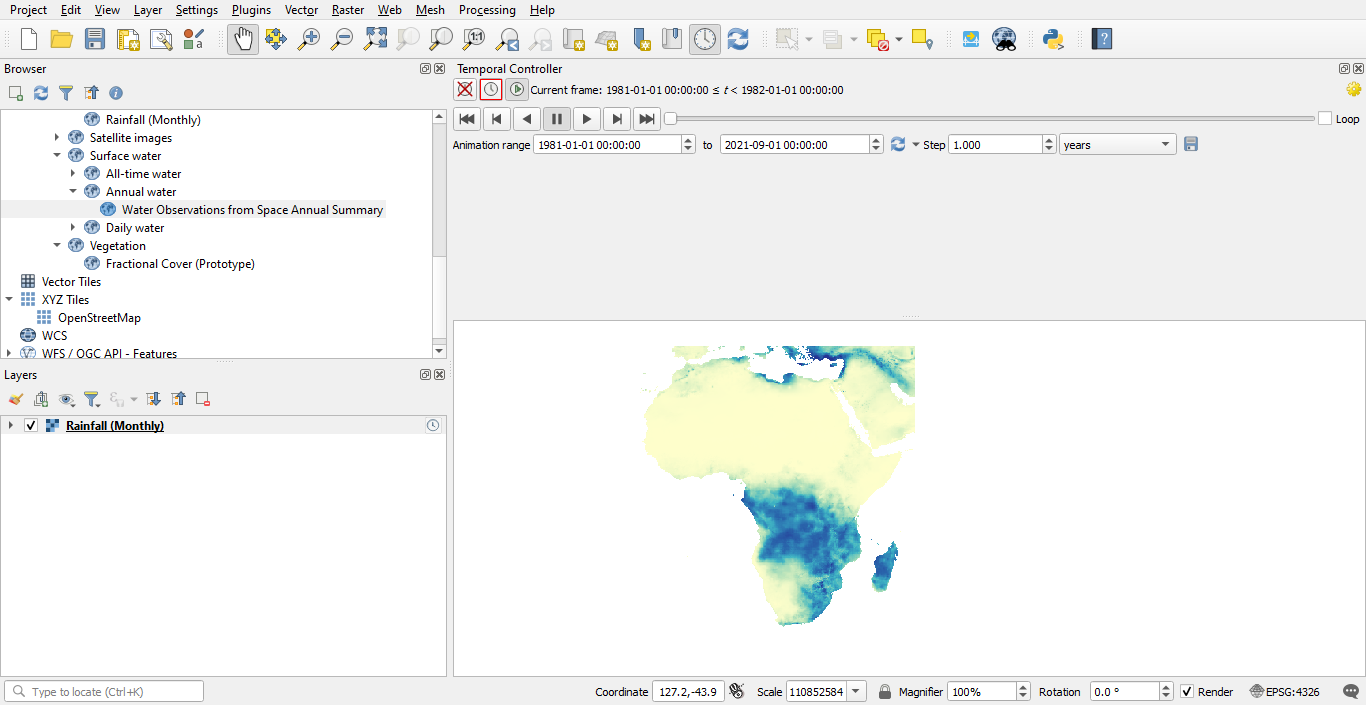
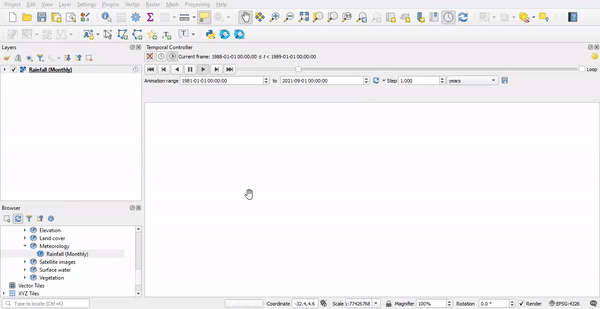
Dans la barre d’outils de navigation de la carte, sélectionnez le symbole de l’horloge pour le panneau du contrôleur temporel pour activer le widget du dock Contrôleur temporel.
Widget de dock Contrôleur temporel activé après avoir cliqué sur l’icône de la barre d’outils Contrôleur temporel.
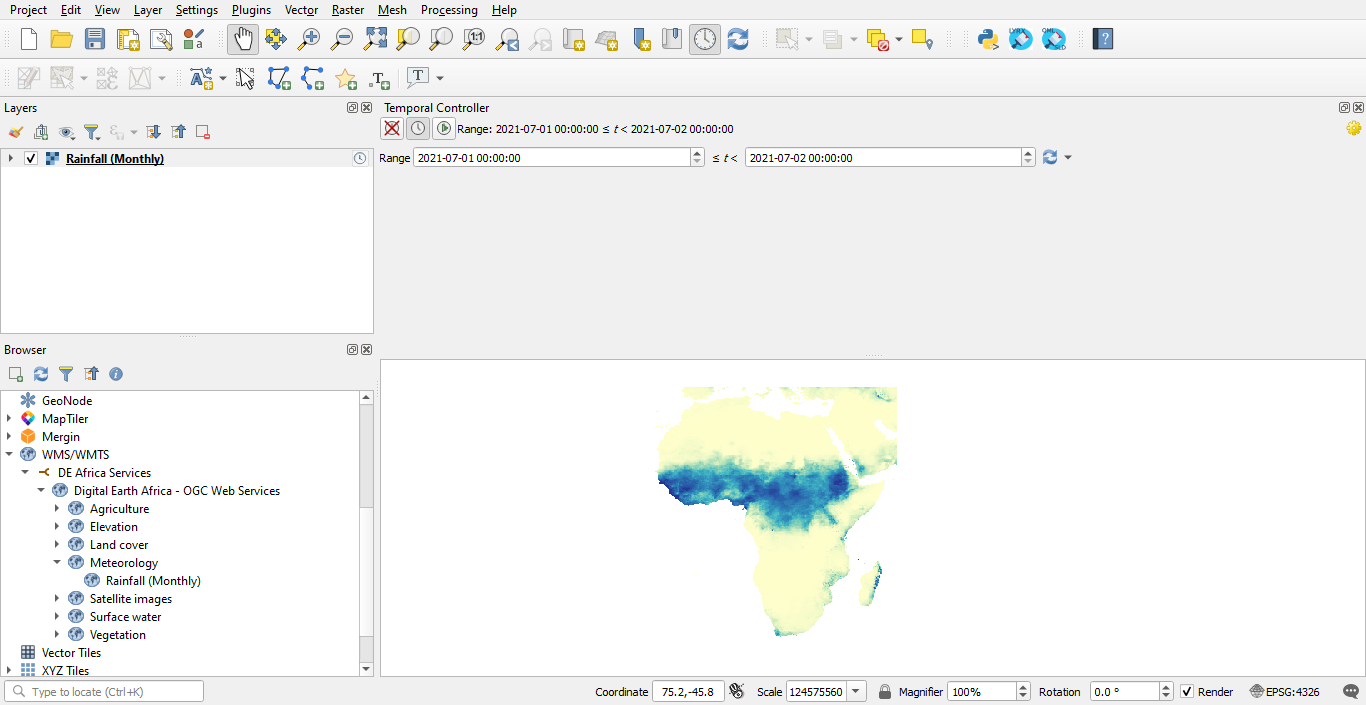
Pour activer la navigation temporelle à plage fixe, sélectionnez l’icône Navigation temporelle à plage fixe |Plage fixe de navigation temporelle| sur le Panneau du contrôleur temporel et définissez la plage temporelle pour les entités de couche à visualiser.
Pour activer la navigation temporelle animée, sélectionnez l’icône Navigation temporelle animée |Navigation temporelle animée| sur le Panneau du contrôleur temporel et définissez la plage d’animation et le pas de temps de l’animation.
Cliquez sur l’icône Play
 pour visualiser l’animation.
Pour rembobiner l’animation jusqu’au début, c’est-à-dire au début de la plage d’animation, cliquez sur l’icône Rembobiner pour démarrer
 .
.
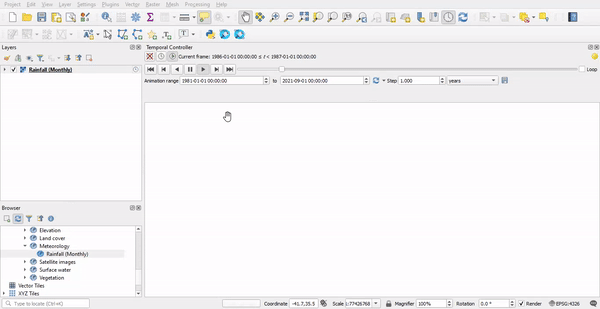
Pour revenir à l’image précédente de l’animation, cliquez sur l’icône Aller à l’image précédente
 . La différence de temps (pas de temps) entre les images consécutives est déterminée par le Pas défini par l’utilisateur.
Pour rembobiner l’animation, cliquez sur l’icône Inverser
 .
.
Pour passer à l’image suivante de l’animation, cliquez sur l’icône Aller à l’image suivante
 . La différence de temps (pas de temps) entre les images consécutives est déterminée par le Pas défini par l’utilisateur.
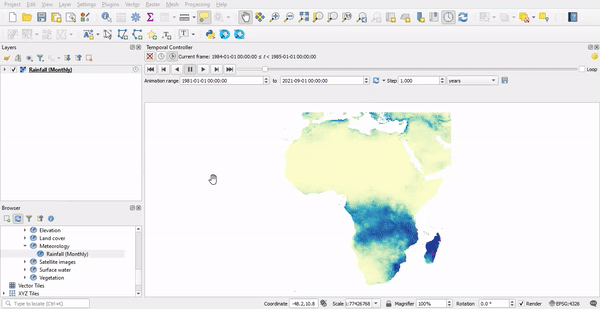
Pour avancer rapidement l’animation jusqu’à la fin, c’est-à-dire passer à la fin de la plage d’animation, cliquez sur l’icône Avance rapide jusqu’à la fin
 .
.
Comment exporter l’animation depuis le contrôleur temporel QGIS
L’animation peut être exportée depuis le contrôleur temporel de QGIS sous forme d’une série d’images. Pour exporter l’animation, cliquez sur l’icône Exporter l’animation |enregistrer| dans le Panneau du contrôleur temporel.
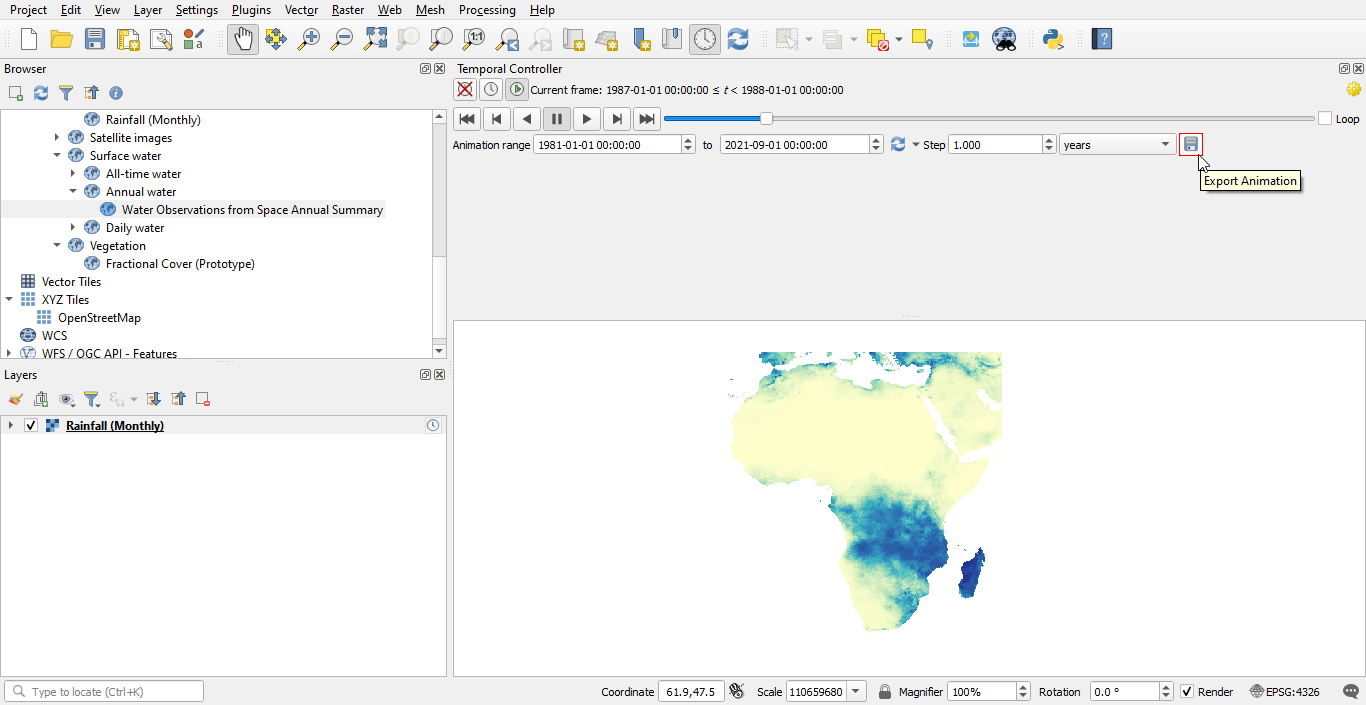
Dans la boîte de dialogue Exporter l’animation de la carte, spécifiez :
Le modèle de dénomination à utiliser pour étiqueter les images.
Le répertoire de sortie où les images seront enregistrées.
L’étendue de la carte à couvrir par les images.
La largeur et la hauteur des images.
La plage temporelle et le pas de temps de l’animation.
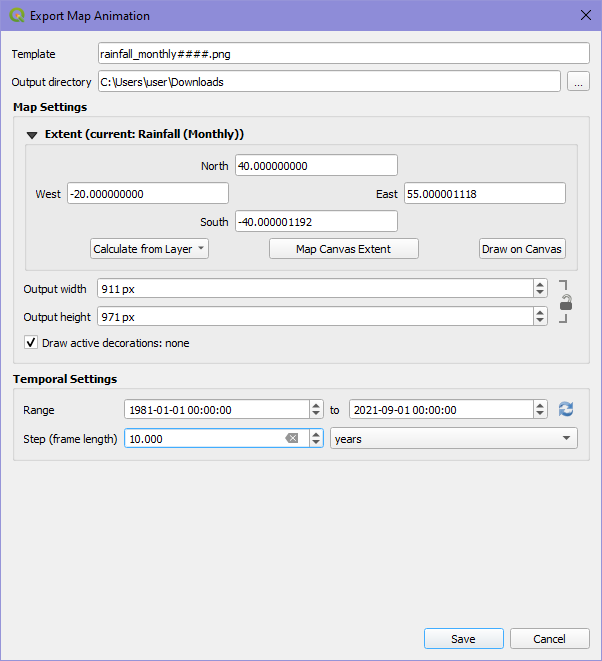
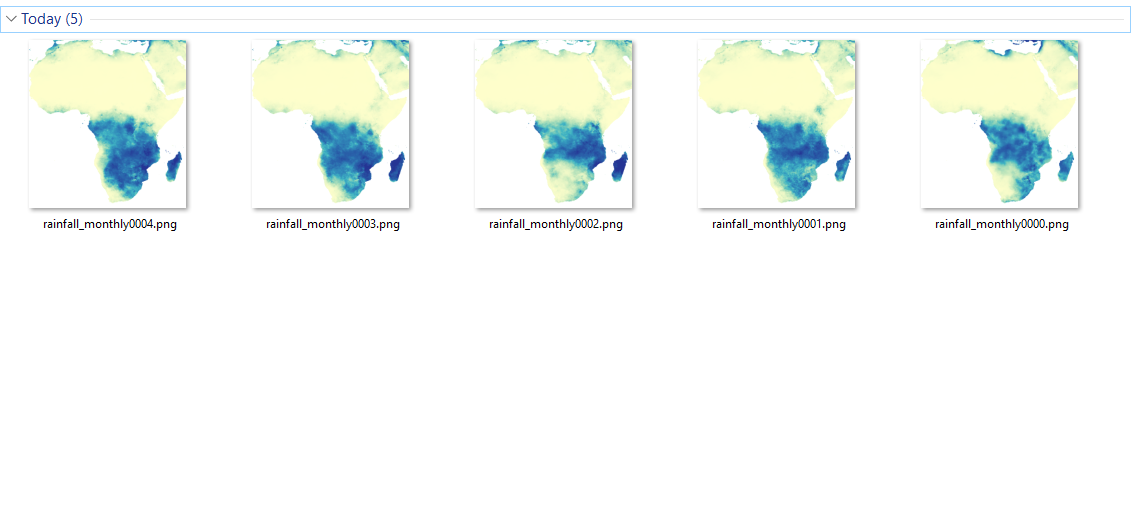
Les images exportées seront enregistrées dans le répertoire de sortie spécifié. À l’aide de votre logiciel préféré, vous pouvez utiliser les images pour créer une animation.
Comment utiliser les couches WMS-T dans QGIS sans le contrôleur temporel
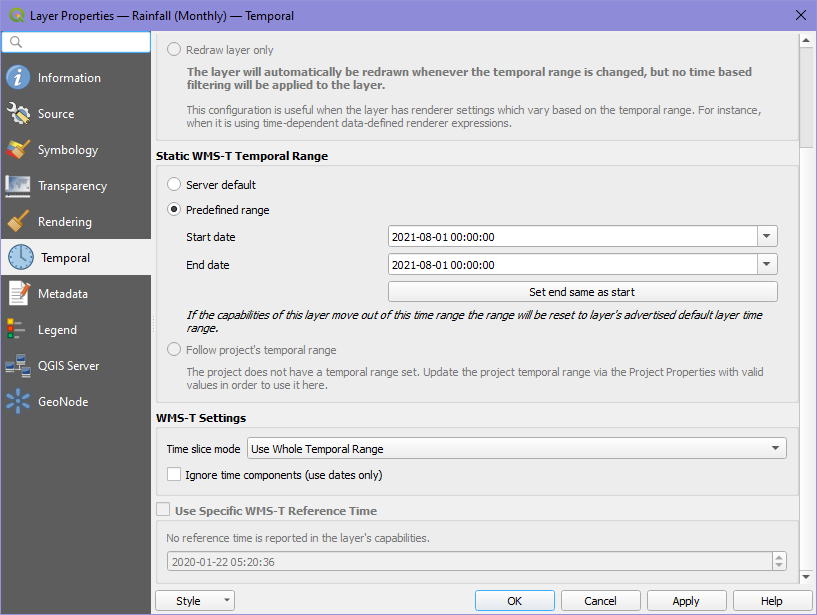
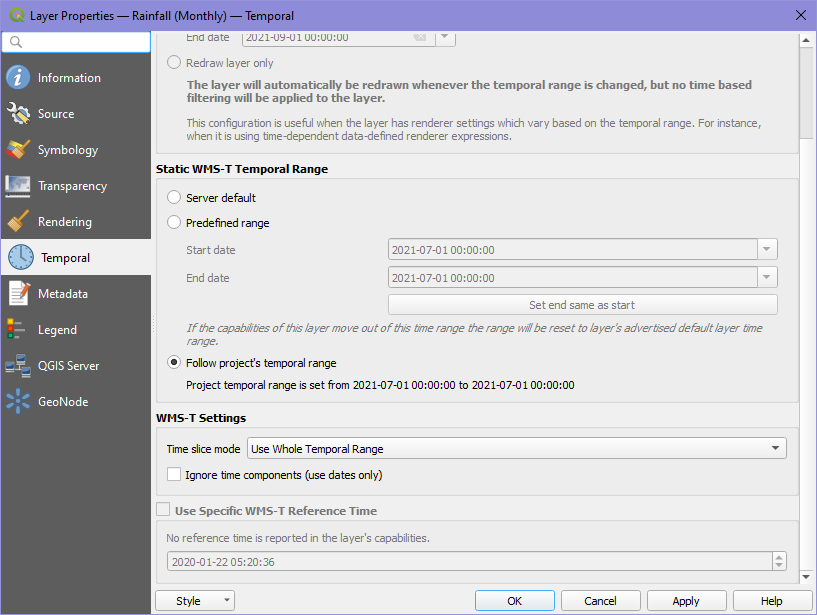
Pour utiliser les couches WMS-T dans QGIS sans le contrôleur temporel, désactivez d’abord le Contrôle temporel dynamique dans les Propriétés de la couche pour activer les paramètres Plage temporelle WMS-T statique. Le paramètre par défaut est la plage temporelle Par défaut du serveur pour visualiser les entités de la couche. Il s’agit d’une plage temporelle prédéfinie définie par le fournisseur de services de données.
Vous remarquerez après avoir désactivé le Contrôle temporel dynamique que la couche n’a plus le symbole d’indicateur temporel |indicateur temporel| à côté du nom de la couche dans le Panneau Calques, cela signifie que la couche n’est plus considérée comme une couche temporelle par QGIS, et ne peut donc pas être utilisée par le Contrôleur temporel.
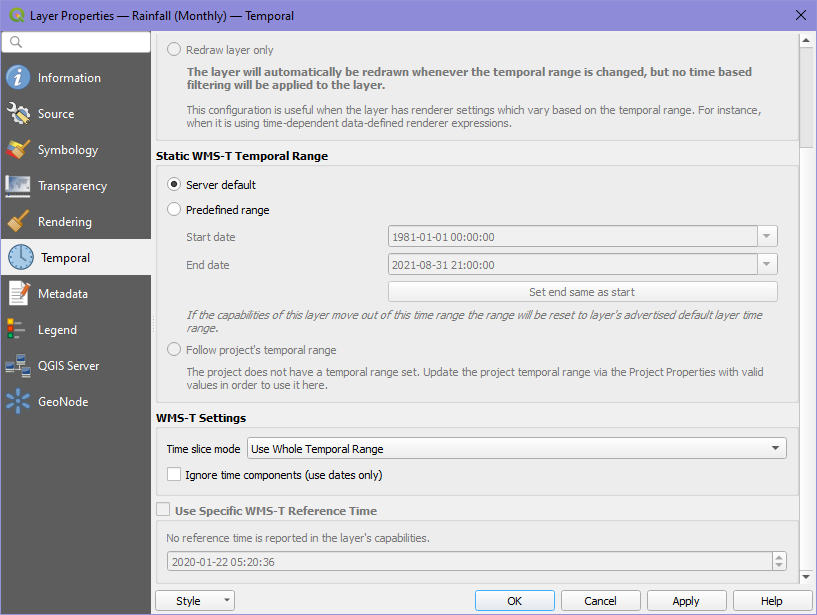
À l’aide de la Plage prédéfinie, vous pouvez définir la plage temporelle des entités de la couche à visualiser à l’aide de la Date de début et de la Date de fin. Un filtre temporel sera appliqué à la couche et les entités extraites seront celles comprises dans la plage temporelle prédéfinie.
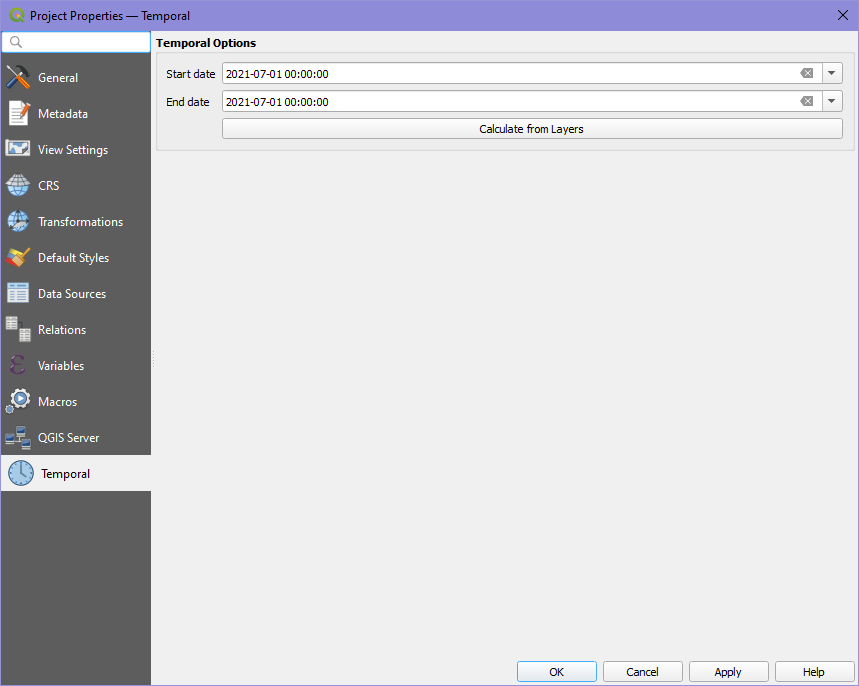
Pour utiliser le paramètre Suivre la plage temporelle du projet, la plage temporelle du projet dans la section Temporelle (Projet > Propriétés > Temporelle) des Propriétés du projet doit être définie. Après avoir défini la plage temporelle du projet, l’application de ce paramètre entraînera la récupération des entités de la couche WMS qui se trouvent dans la plage temporelle du projet.
Paramètres WMS-T
Vous pouvez également spécifier le mode de tranche de temps utilisé pour le Contrôle temporel dynamique et la Plage temporelle statique WMS-T. Quatre options sont disponibles pour le mode de tranche de temps :
Utiliser toute la plage temporelle : permet à l’utilisateur de définir la plage temporelle pour les entités de couche à visualiser/tracer.
Correspondance avec le début de la plage : les entités de couche visualisées seront des entités qui correspondent au début de la plage temporelle de la couche.
Correspondance avec la fin de la plage : les entités de couche visualisées seront des entités qui correspondent à la fin de la plage temporelle de la couche.
Correspondance la plus proche du début de la plage : visualise les entités de couche dont la date et l’horodatage sont les plus proches du début de la plage temporelle définie.
Correspondance la plus proche à la fin de la plage : visualise les entités de couche dont la date et l’horodatage sont les plus proches de la fin de la plage temporelle définie.
Vous pouvez également activer l’option Ignorer les composants temporels qui permet à QGIS de prendre en compte uniquement les dates lors de l’application d’un filtre basé sur le temps aux entités de la couche en fonction d’une plage temporelle définie, sans prendre en compte le composant temporel.
Comment connecter WCS
Lancez QGIS.
Dans la barre de menu, cliquez sur Calque.
Un onglet de sous-menu s’affichera sous Calque ; cliquez sur Ajouter un calque, choisissez Ajouter un calque WCS.
Cliquez sur le bouton Nouveau.
Une boîte de dialogue s’ouvrira, comme indiqué ci-dessous : Fournissez les détails suivants, vous les trouverez à l’URL https://ows.digitalearth.africa/
« Nom : DE Africa Services »
URL: https://ows.digitalearth.africa/wcs?version=2.1.0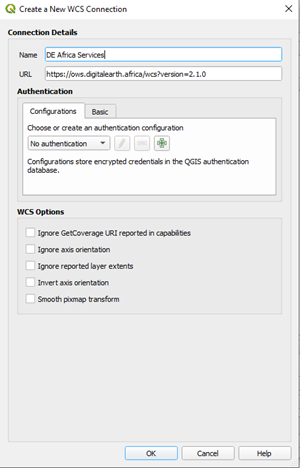
Après avoir fourni les détails ci-dessus, cliquez sur OK.
La boîte de dialogue précédente apparaîtra, dans la liste déroulante au-dessus du bouton Nouveau, vous verrez DE Africa Services, s’il n’est pas là, cliquez sur le bouton déroulant ci-dessous et sélectionnez-le.
Le bouton Connecter sera activé, cliquez dessus pour charger les couches. A chaque fois que cette page est ouverte, étant donné que la connexion a déjà été établie, cliquez sur le bouton Connecter pour charger les données.
La couche sera chargée comme indiqué ci-dessous dans la boîte de dialogue.
Parcourez les calques et choisissez celui que vous souhaitez afficher sur la page Carte. Avec WCS, vous pouvez sélectionner l’heure et le format de l’image.
Après avoir sélectionné le calque, cliquez sur le bouton Ajouter en bas de la boîte de dialogue.
ArcGIS Pro
Mise en place du WMS
Ce didacticiel explique comment configurer les services de cartographie Web dans ArcGIS Pro et les utiliser avec d’autres données sur votre ordinateur, telles que des images de drone, des données vectorielles ou raster. Cela peut vous être utile si vous ne pouvez pas télécharger les données sur la carte DE Africa ou sur le bac à sable DE Africa en raison du téléchargement en raison de la taille ou de la bande passante Internet. Cela peut également être utile si vous vous sentez plus à l’aise pour effectuer des analyses dans une application SIG.
Lancez ArcGIS Pro.
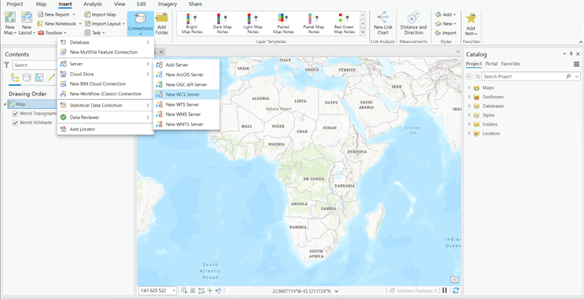
Dans la barre de menu, cliquez sur Insérer.
Dans le groupe Projet, cliquez sur Connexions et un menu déroulant apparaîtra sous Connexions ; cliquez sur Serveur et choisissez Ajouter un serveur WMS.
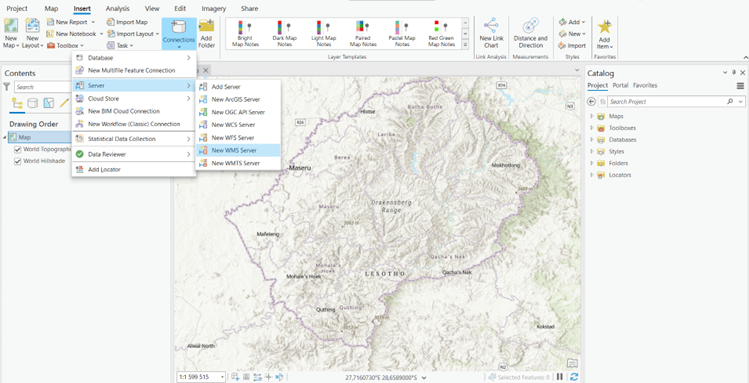
Une boîte de dialogue s’ouvrira, comme indiqué ci-dessous : indiquez l’URL du serveur, qui se trouve à l’URL https://ows.digitalearth.africa/.
URL: https://ows.digitalearth.africa/wms?version=1.3.0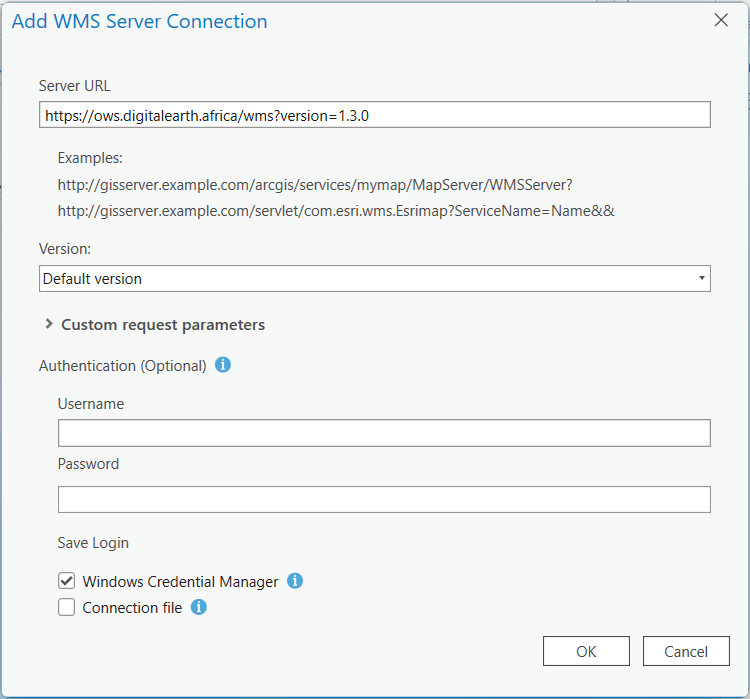
Après avoir fourni l’URL du serveur ci-dessus, cliquez sur OK.
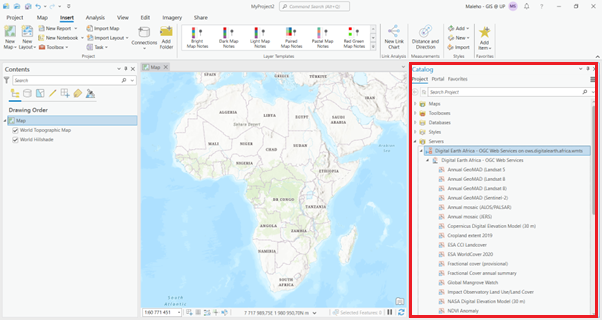
Cela ajoutera le serveur WMS Digital Earth Africa au volet Catalogue, sous Serveurs.
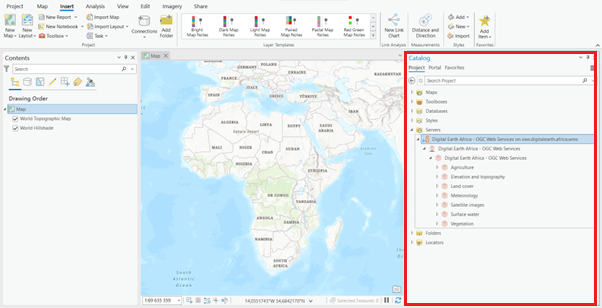
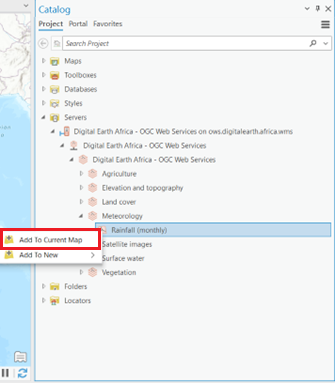
Naviguez dans les calques et choisissez celui que vous devez afficher dans la vue Carte.
Après avoir sélectionné la couche, faites un clic droit sur la couche et sélectionnez Ajouter à la carte actuelle (vous pouvez également faire glisser et déposer la couche sur la vue Carte).
La couche sélectionnée sera chargée dans la vue Carte.
Pour les développeurs Web
Les sites ci-dessous fournissent des instructions sur la façon de charger ces services cartographiques sur votre plateforme.
https://leafletjs.com/examples/wms/wms.html
Ajouter des couches WMS-T (temps pris en charge)
Les services Web de Digital Earth Africa prennent en charge WMS-T (WMS avec heure). Les couches WMS-T permettent aux utilisateurs de naviguer sur différentes périodes de temps.
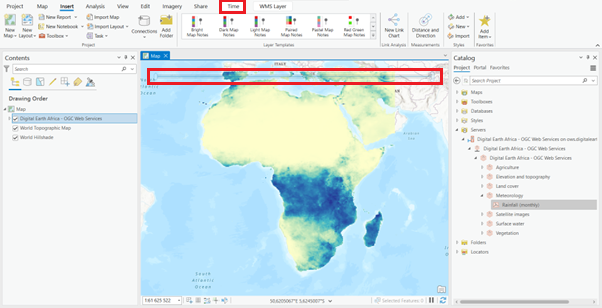
Comment ajouter des couches WMS-T à l’aide d’ArcGIS Pro
Connectez-vous au service de carte Web dans ArcGIS en suivant les instructions du didacticiel de configuration de WMS <#Tutorial:-Setting-up-WMS>`__.
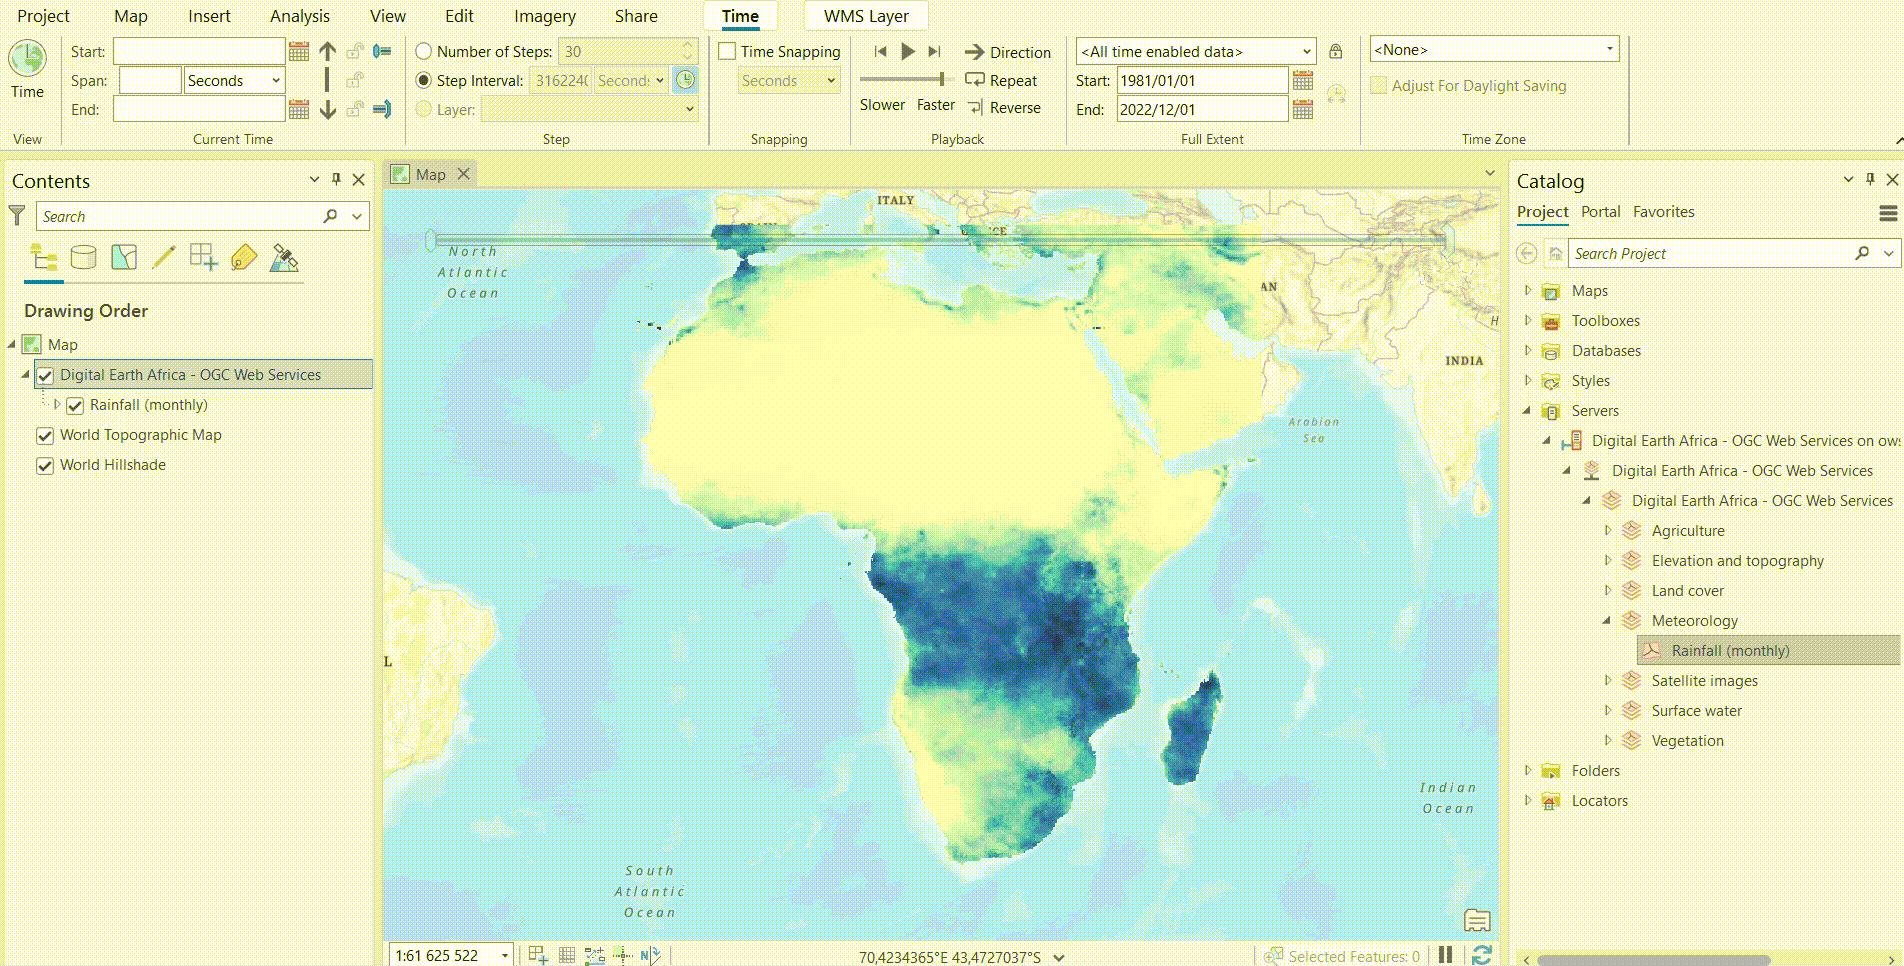
Dans le volet Catalogue, accédez à Serveurs et développez-le pour afficher la connexion Digital Earth Africa - OGC Web Services sur ows.digitalearth.africa.wms.
Sélectionnez une couche WMS-T à partir des couches de connexion Digital Earth Africa - OGC Web Services sur ows.digitalearth.africa.wms. Pour ajouter la couche à la vue cartographique, faites un clic droit sur la couche et sélectionnez Ajouter à la carte actuelle (vous pouvez également faire glisser et déposer la couche sur la vue cartographique).
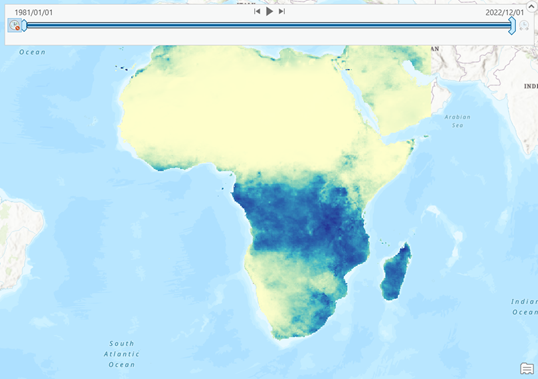
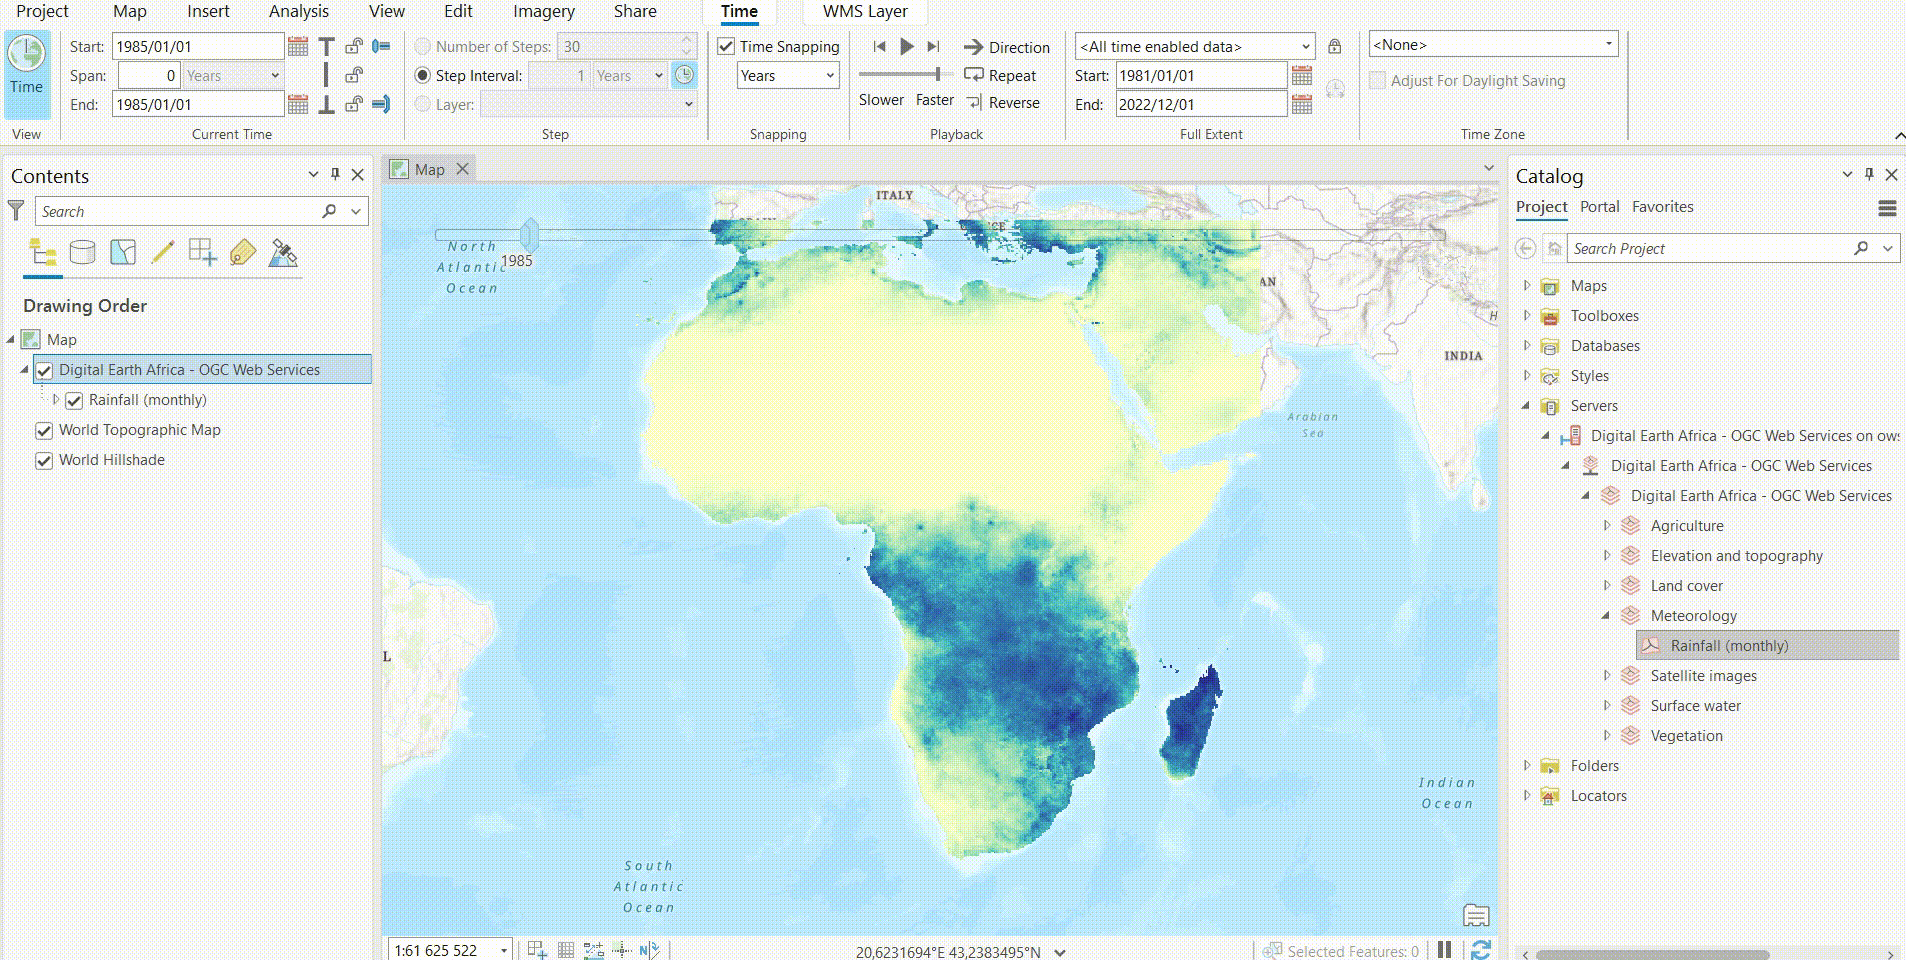
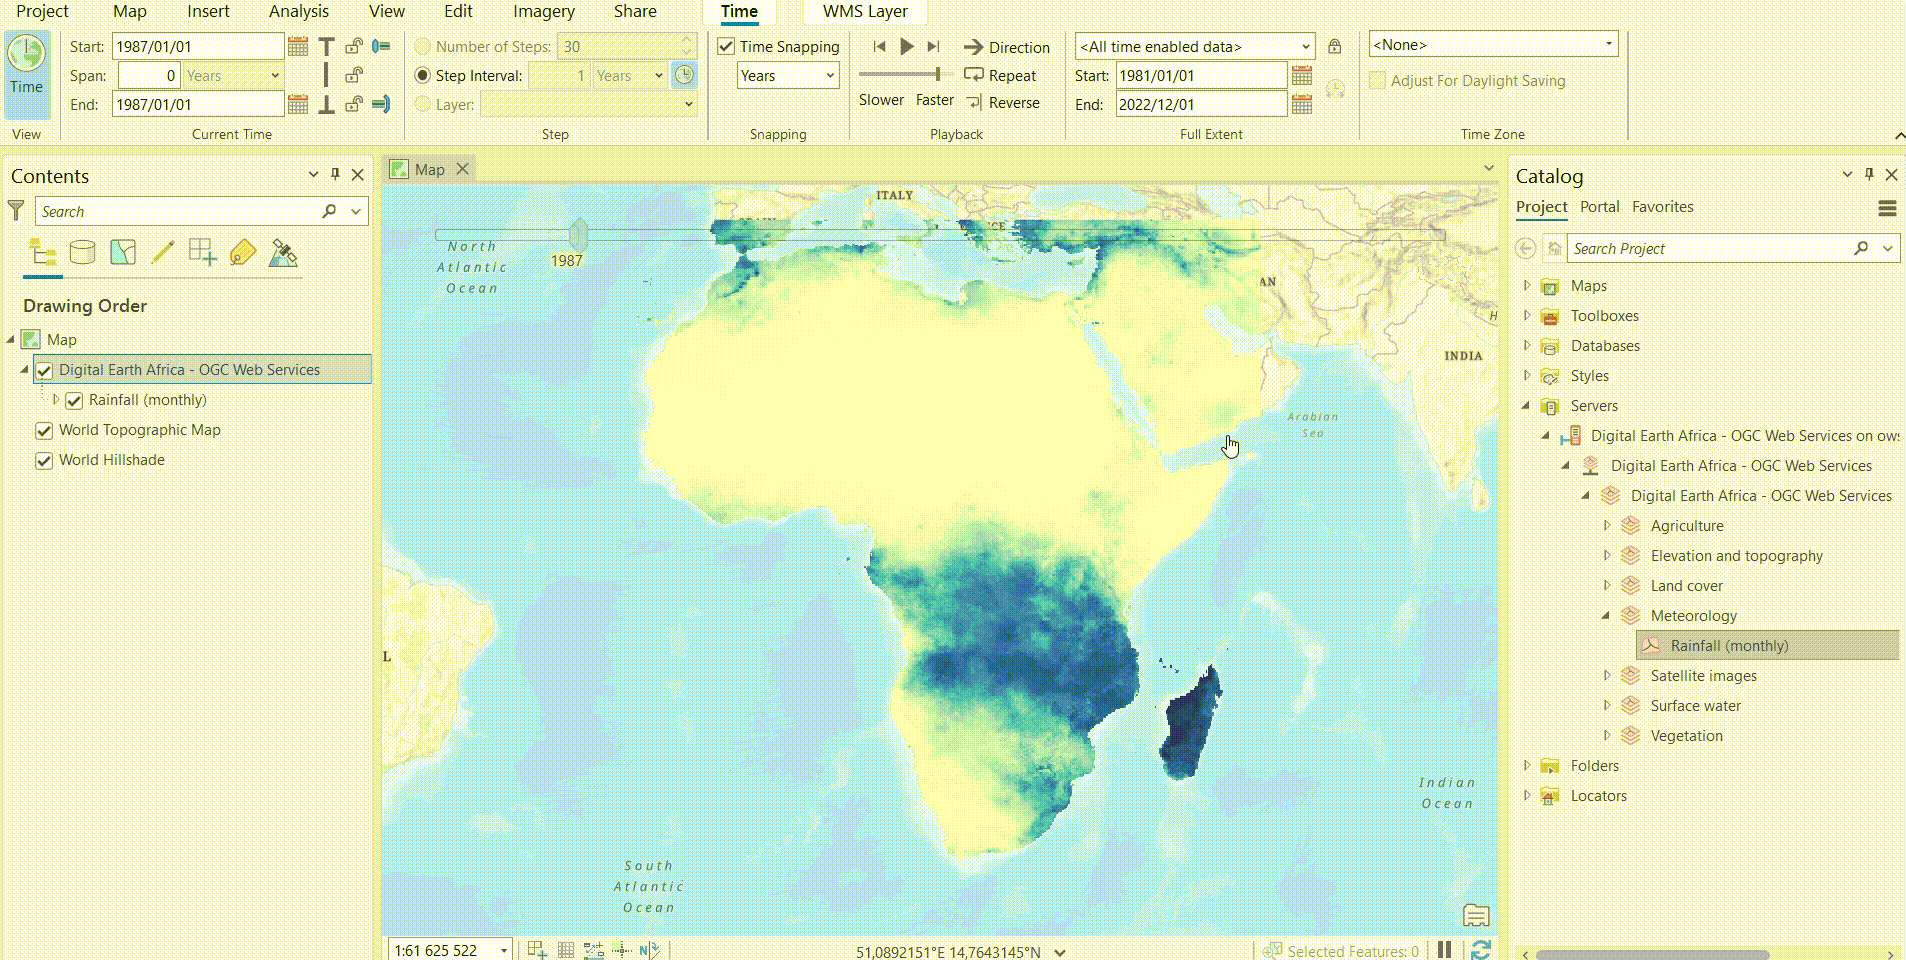
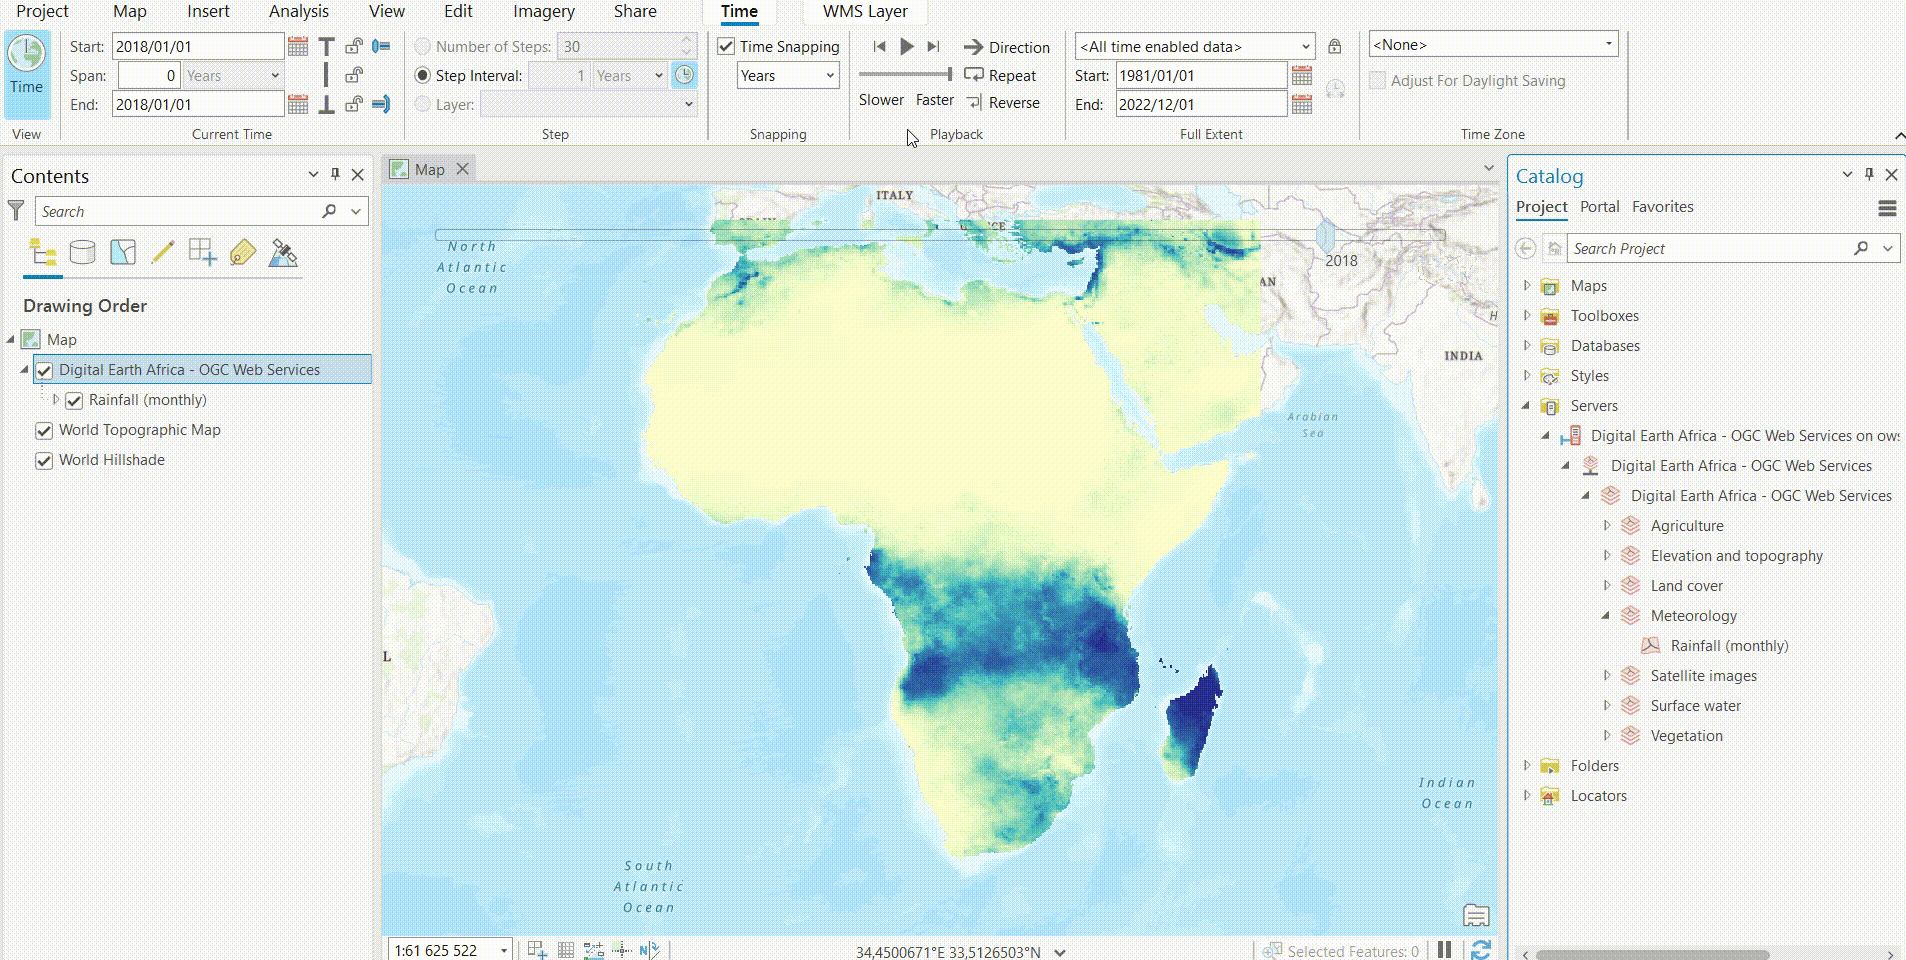
La couche sera chargée dans la vue Carte avec un onglet contextuel Heure ajouté à la barre Menu et un Curseur de temps en haut de la vue Carte, indiquant qu’il s’agit d’une couche temporelle.
Comment utiliser le curseur temporel d’ArcGIS Pro avec les couches WMS-T
Pour utiliser le Time Slider pour les calques WMS-T, passez la souris sur le Time Slider pour voir ses commandes. Sur le côté gauche de l’icône Time Slider, cliquez sur Time disabled
 pour le changer en Time enabled
  .
.
Vous pouvez configurer les paramètres de temps de votre calque. Cliquez sur l’onglet Heure dans la barre de Menu. Dans le groupe Accroche, cochez la case Accroche temporelle.
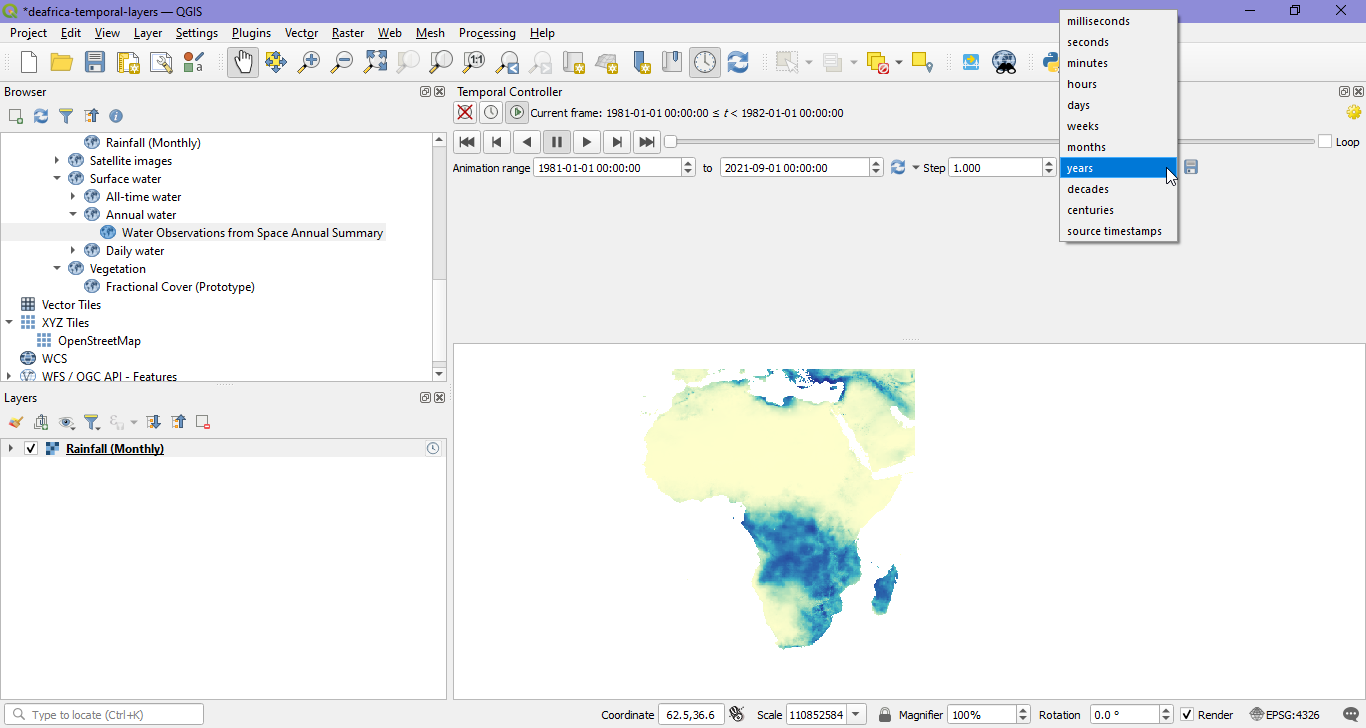
Sous la case à cocher Time Snapping, cliquez sur la liste déroulante Time Snap Interval et sélectionnez Années.
Cela correspond aux intervalles annuels des données.
Dans le groupe Heure actuelle, modifiez le paramètre Span sur 0 et appuyez sur la touche Entrée.
Cela garantit que seule une année de données s’affiche à la fois.
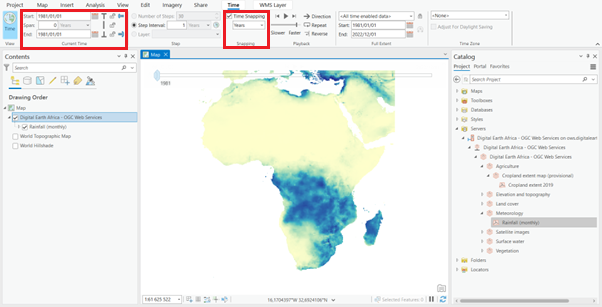
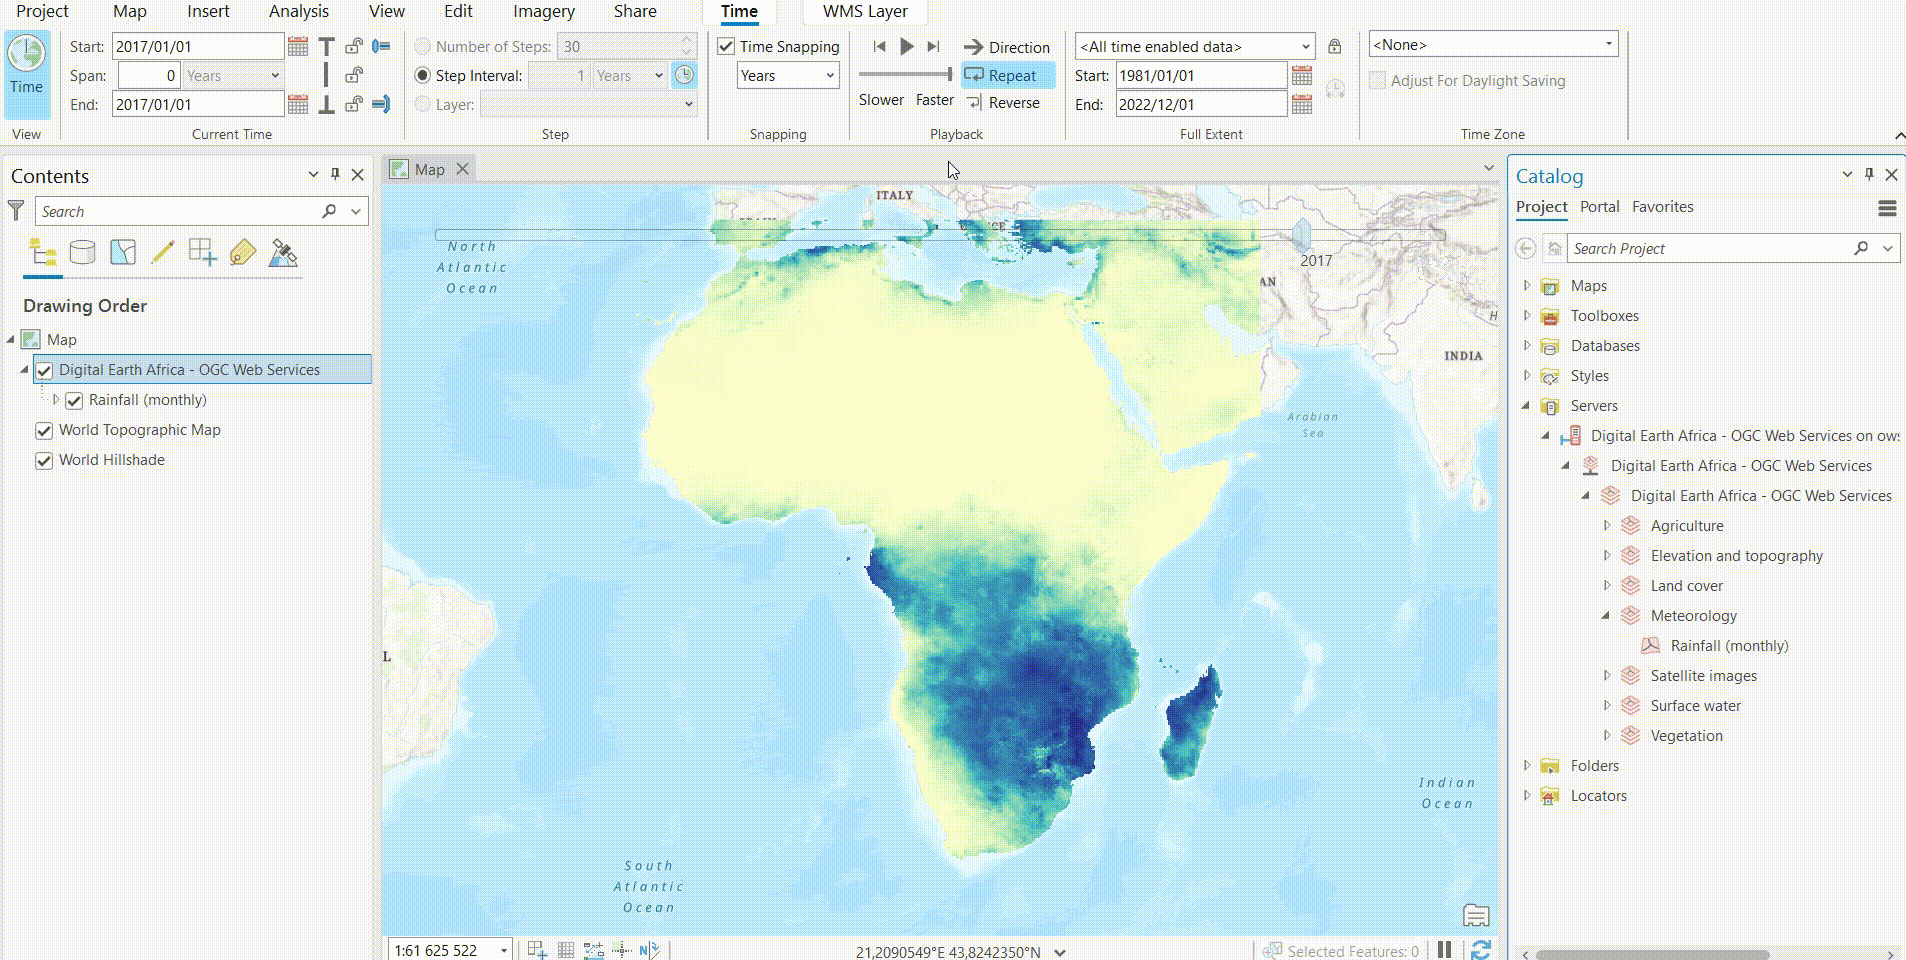
Dans le groupe Lecture, cliquez sur Lire toutes les étapes |lire toutes les étapes|.
Pour régler les commandes du curseur de temps vers l’arrière en fonction du paramètre d’étape (c’est-à-dire reculer d’une étape de temps), cliquez sur l’icône Retour en arrière |revenir en arrière|.
Pour régler les commandes du curseur de temps vers l’avant en fonction du paramètre d’étape (c’est-à-dire avancer d’un pas), cliquez sur l’icône Pas en avant |pas en avant|.
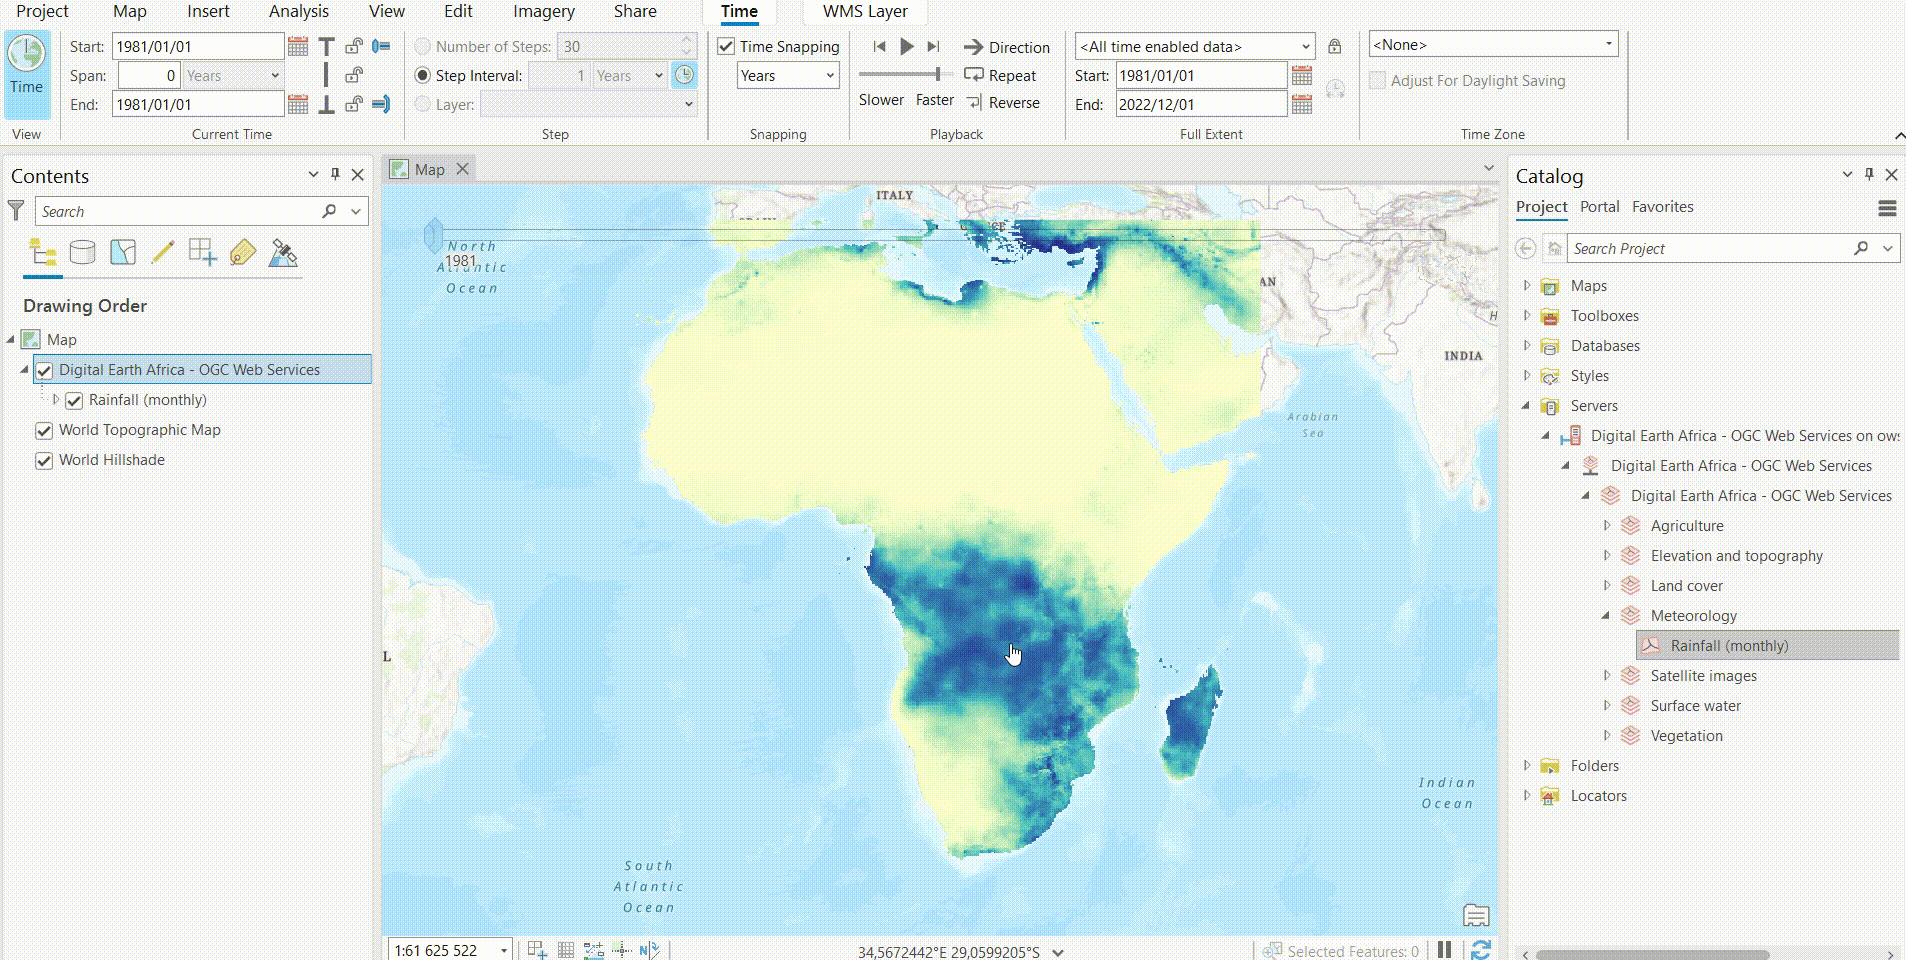
Pour définir la vitesse relative de la visualisation en ajustant la durée de pause entre les étapes, utilisez l’icône Ajuster la vitesse de lecture |ajuster la vitesse de lecture|.
Pour définir si la lecture de toutes les étapes commence par un déplacement vers l’avant ou vers l’arrière dans le temps à travers les données, cliquez sur l’icône Direction
 .
.
Pour que la lecture continue en boucle dans la même direction après avoir atteint la dernière étape à la fin du curseur temporel, cliquez sur l’icône Répéter |répéter|.
Pour que la lecture continue en boucle dans la direction opposée après avoir atteint la dernière étape à la fin du curseur temporel, cliquez sur l’icône Inverser
 .
.
Comment exporter l’animation depuis ArcGIS Time Slider
Pour exporter l’animation, cliquez sur l’onglet Affichage. Dans le groupe Animation, cliquez sur Ajouter.
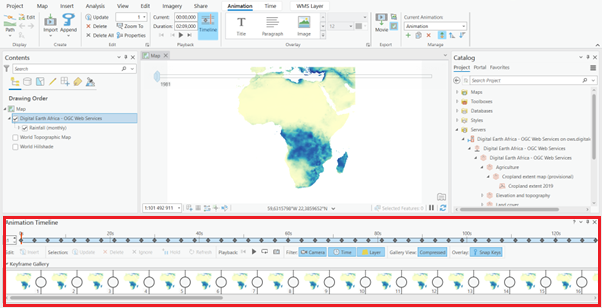
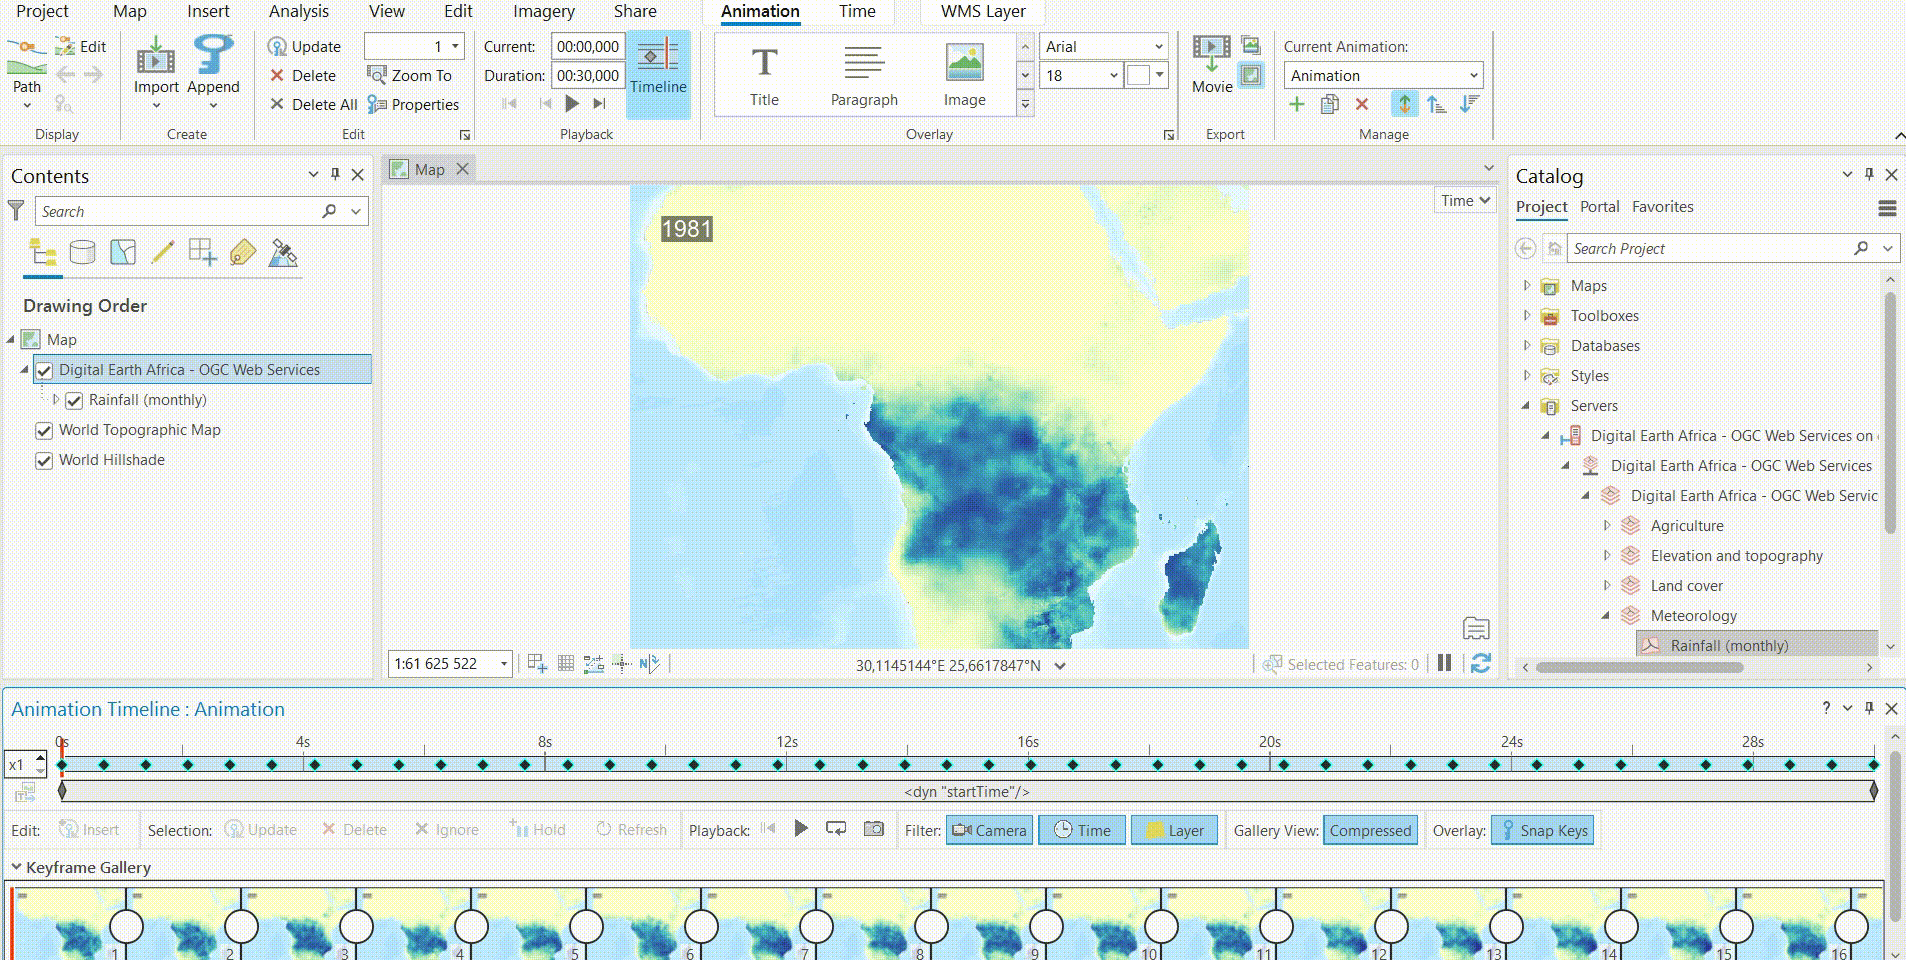
Un volet Chronologie d’animation vide apparaît sous la vue Carte. Dans la barre de Menu, un onglet Animation contextuel apparaît.
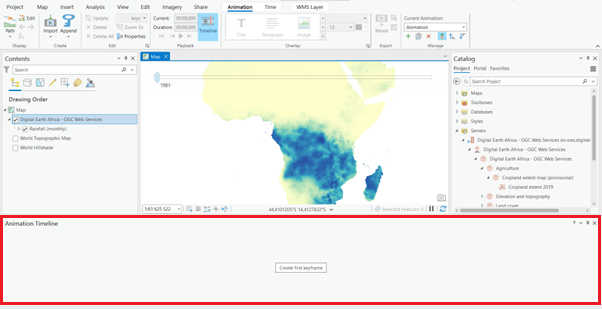
Avant de créer des images clés pour l’animation, vous devez effectuer un zoom sur l’étendue de la carte appropriée. Dans le volet Contenu, faites un clic droit sur le calque et Zoom sur le calque.
Dans la barre de menus, cliquez sur l’onglet Animation. Dans le groupe Créer, cliquez sur Importer une animation, puis sur Étapes du curseur temporel.
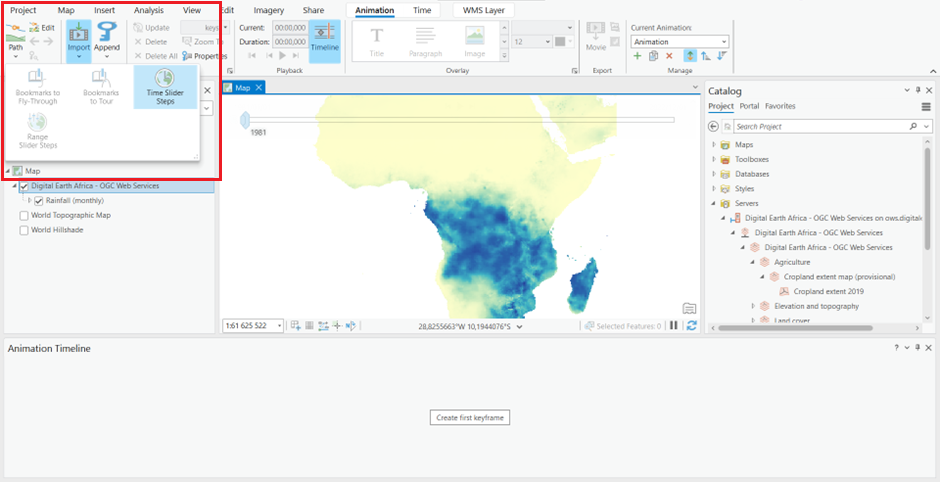
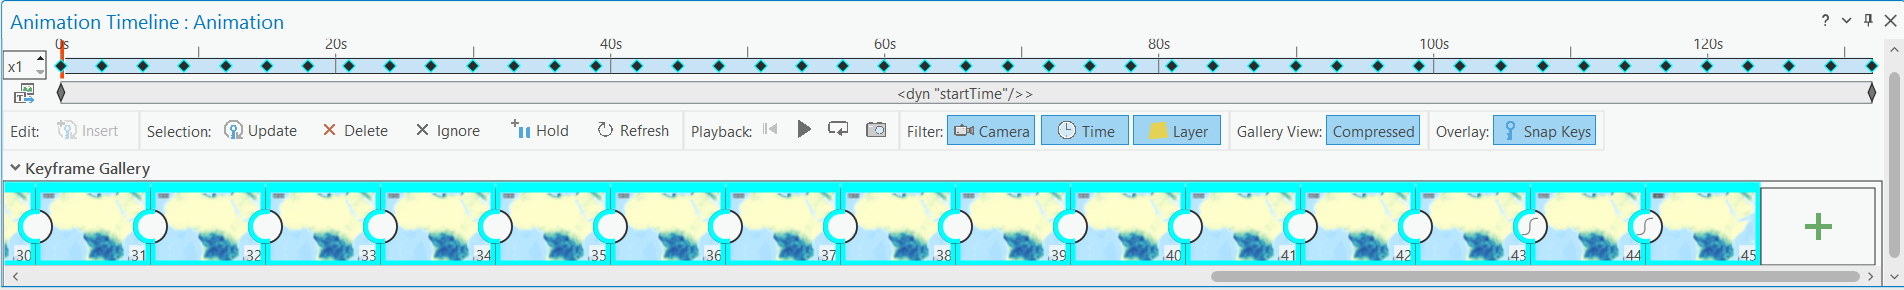
Le volet Chronologie de l’animation est rempli d’images clés (il faut quelques instants pour que les images s’affichent dans les images clés). La première image clé représente l’animation à zéro seconde (00:00.0000). Chaque image clé suivante correspond aux données d’une année.
Dans l’onglet Animation, dans le groupe Lecture, le paramètre Durée vous indique la durée de l’animation. Vous pouvez remplacer la valeur de durée (par exemple, 00:30 - ce qui donnera une durée de l’animation de 30 secondes).
Au fur et à mesure de la lecture de l’animation, vous souhaiterez peut-être afficher l’année à laquelle correspondent les données. Pour ce faire, vous ajouterez du texte dynamique, c’est-à-dire des informations qui se mettent à jour pendant la lecture.
Dans le panneau Chronologie d’animation, sous Galerie d’images clés, cliquez sur la première image clé pour la sélectionner et faites défiler jusqu’à la fin de la galerie, maintenez la touche Maj enfoncée, puis cliquez sur la dernière image clé. Cela sélectionnera toutes les images clés de votre animation.
Le texte dynamique que vous ajoutez à l’étape suivante sera appliqué à toutes les images clés sélectionnées, en d’autres termes, tout au long de l’animation.
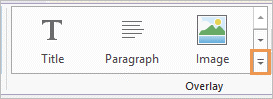
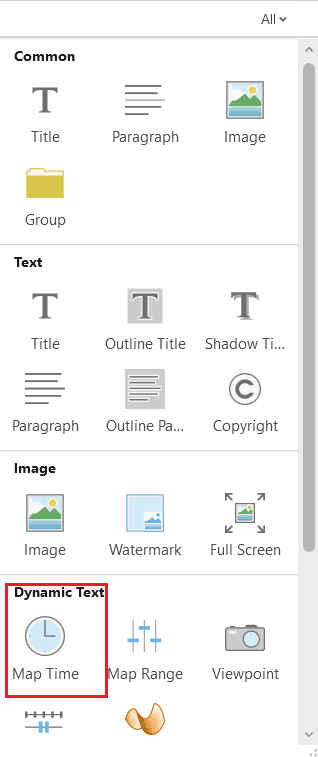
Dans la barre Menu, dans l’onglet Animation, dans le groupe Superposition, développez la galerie Superposition.
In the Overlay gallery, under Dynamic test, click Map Time.
- Dans la zone de texte dynamique qui apparaît dans la vue Carte, remplacez l’expression par défaut sur deux lignes par
<dyn type="animation" property="startTime" format="yyyy"/>The expression created a single label, rather than a start and end time, and formats it display the year ratheer than a full date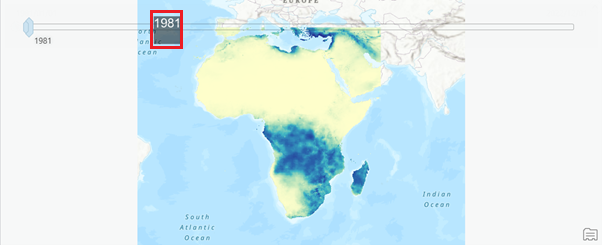
Dans le groupe Lecture de l’onglet Animation, cliquez sur Lecture (Ne cliquez pasLecturesur leCurseur temporelcar les modifications que vous avez apportées à l’animation ne sont pas reflétées dans leCurseur temporellecture.
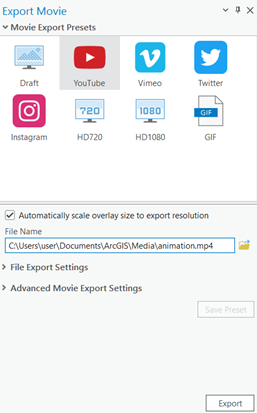
Dans l’onglet Animation, dans le groupe Exporter, cliquez sur Exportation de film |exportation de film|
Dans le volet Exporter le film, dans la zone Nom de fichier, donnez à votre animation un nom approprié.
Si vous le souhaitez, cliquez sur Parcourir |parcourir| et accédez à un autre dossier pour enregistrer la vidéo.
Then click Export.
Comment connecter WCS
Lancez ArcGIS Pro.
Dans la barre de menu, cliquez sur Insérer.
Dans le groupe Projet, cliquez sur Connexions et un menu déroulant apparaîtra sous Connexions ; cliquez sur Serveur et choisissez Ajouter un serveur WCS.
Une boîte de dialogue s’ouvrira, comme indiqué ci-dessous : indiquez l’URL du serveur, qui se trouve à l’URL https://ows.digitalearth.africa/.
URL: https://ows.digitalearth.africa/wcs?version=1.3.0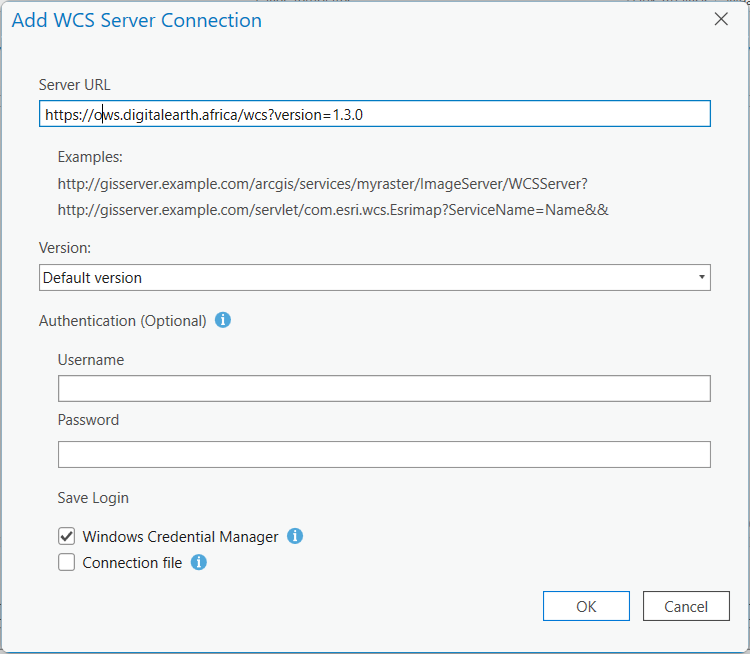
Après avoir fourni l’URL du serveur ci-dessus, cliquez sur OK.
Cela ajoutera le serveur WCS Digital Earth Africa au volet Catalogue, sous Serveurs.
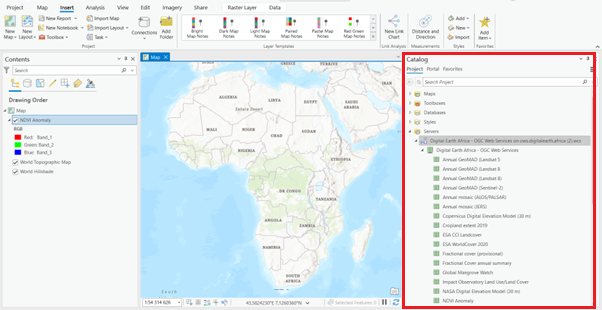
Naviguez dans les calques et choisissez celui que vous devez afficher dans la vue Carte.
Après avoir sélectionné la couche, faites un clic droit sur la couche et sélectionnez Ajouter à la carte actuelle (vous pouvez également faire glisser et déposer la couche sur la vue Carte).
La couche sélectionnée sera chargée dans la vue Carte.
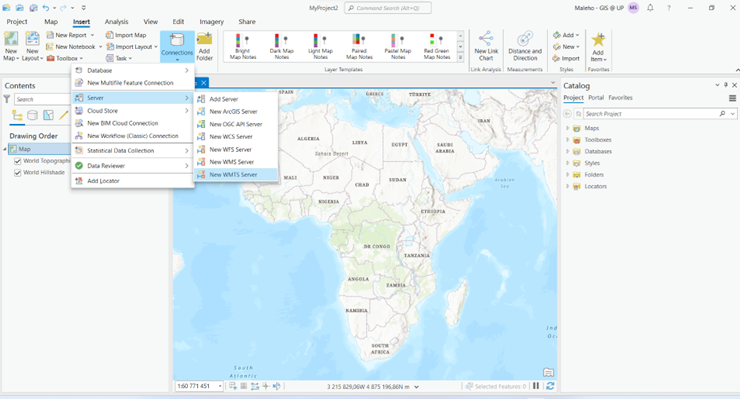
Comment connecter WMTS
Lancez ArcGIS Pro.
Dans la barre de menu, cliquez sur Insérer.
Dans le groupe Projet, cliquez sur Connexions et un menu déroulant apparaîtra sous Connexions ; cliquez sur Serveur et choisissez Ajouter un serveur WMTS.
Une boîte de dialogue s’ouvrira, comme indiqué ci-dessous : indiquez l’URL du serveur, qui se trouve à l’URL https://ows.digitalearth.africa/.
URL: https://ows.digitalearth.africa/wmts?version=1.0.0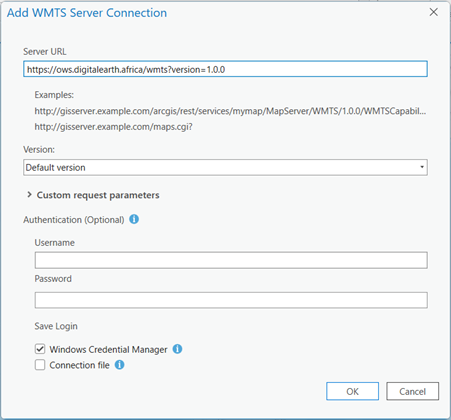
Après avoir fourni l’URL du serveur ci-dessus, cliquez sur OK.
Cela ajoutera le serveur WMTS Digital Earth Africa au volet Catalogue, sous Serveurs.
Naviguez dans les calques et choisissez celui que vous devez afficher dans la vue Carte.
Après avoir sélectionné la couche, faites un clic droit sur la couche et sélectionnez Ajouter à la carte actuelle (vous pouvez également faire glisser et déposer la couche sur la vue Carte).
La couche sélectionnée sera chargée dans la vue Carte.
[ ]: